
Houses for sale & to rent in Glastonbury, Somerset
House Prices in Glastonbury
Properties in Glastonbury have an average house price of £334,188.00 and had 693 Property Transactions within the last 3 years.¹
Glastonbury is an area in Somerset with 5,626 households², where the most expensive property was sold for £1,935,000.00.
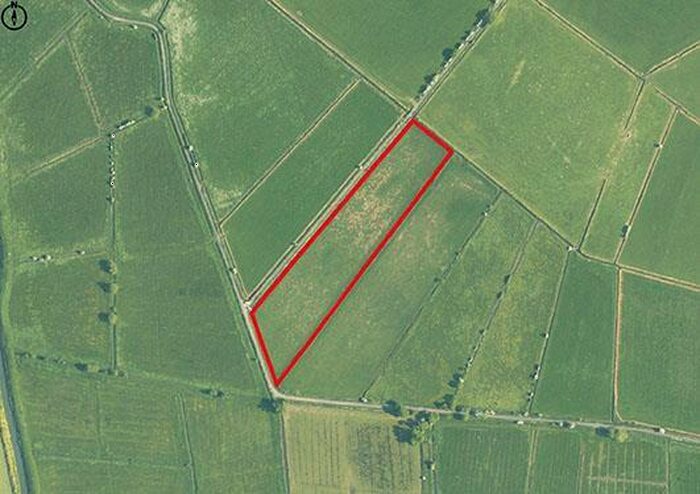
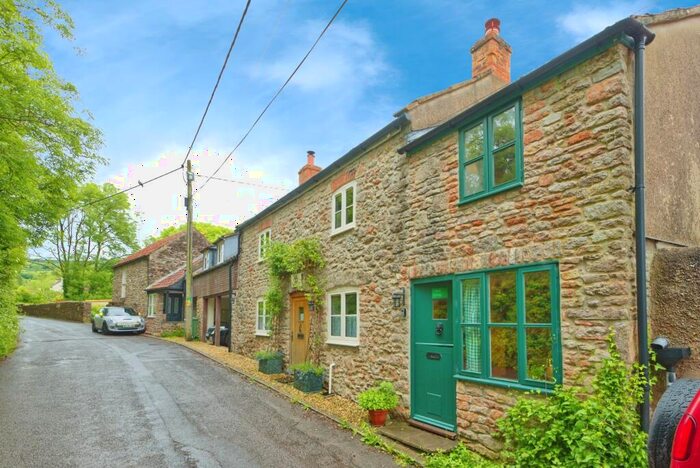
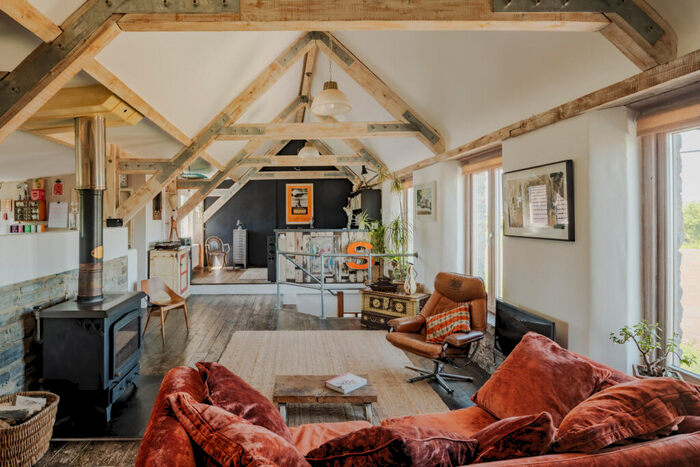
Properties for sale in Glastonbury


Neighbourhoods in Glastonbury
Navigate through our locations to find the location of your next house in Glastonbury, Somerset for sale or to rent.
Transport in Glastonbury
Please see below transportation links in this area:
-
 Castle Cary Station
 -
Bruton Station
-
Bridgwater Station
-
Highbridge and Burnham Station
-
Yeovil Pen Mill Station
- FAQ
- Price Paid By Year
- Property Type Price
Frequently asked questions about Glastonbury
What is the average price for a property for sale in Glastonbury?
The average price for a property for sale in Glastonbury is £334,188. This amount is 4% higher than the average price in Somerset. There are 4,381 property listings for sale in Glastonbury.
What locations have the most expensive properties for sale in Glastonbury?
The locations with the most expensive properties for sale in Glastonbury are The Pennards And Ditcheat at an average of £625,211, Butleigh And Baltonsborough at an average of £575,627 and Moor at an average of £419,224.
What locations have the most affordable properties for sale in Glastonbury?
The locations with the most affordable properties for sale in Glastonbury are Glastonbury St Benedicts at an average of £214,851, Glastonbury St Johns at an average of £273,248 and Glastonbury St Marys at an average of £337,463.
Which train stations are available in or near Glastonbury?
Some of the train stations available in or near Glastonbury are Castle Cary, Bruton and Bridgwater.
Property Price Paid in Glastonbury by Year
The average sold property price by year was:
| Year | Average Sold Price | Price Change |
Sold Properties
|
|---|---|---|---|
| 2024 | £238,053 | -52% |
27 Properties |
| 2023 | £361,687 | 5% |
163 Properties |
| 2022 | £343,635 | 7% |
211 Properties |
| 2021 | £320,901 | 7% |
292 Properties |
| 2020 | £297,338 | 1% |
250 Properties |
| 2019 | £294,922 | 2% |
230 Properties |
| 2018 | £288,631 | 5% |
242 Properties |
| 2017 | £272,940 | -1% |
275 Properties |
| 2016 | £274,883 | 16% |
317 Properties |
| 2015 | £231,430 | 3% |
281 Properties |
| 2014 | £223,377 | 5% |
308 Properties |
| 2013 | £213,196 | -2% |
243 Properties |
| 2012 | £217,692 | 6% |
220 Properties |
| 2011 | £204,587 | -14% |
193 Properties |
| 2010 | £233,142 | 4% |
237 Properties |
| 2009 | £223,659 | 7% |
163 Properties |
| 2008 | £209,074 | -8% |
185 Properties |
| 2007 | £226,522 | 11% |
316 Properties |
| 2006 | £201,357 | 10% |
374 Properties |
| 2005 | £181,422 | -2% |
250 Properties |
| 2004 | £185,431 | 8% |
316 Properties |
| 2003 | £170,072 | 9% |
277 Properties |
| 2002 | £154,209 | 22% |
319 Properties |
| 2001 | £119,515 | 12% |
352 Properties |
| 2000 | £104,609 | 16% |
293 Properties |
| 1999 | £87,644 | 7% |
307 Properties |
| 1998 | £81,650 | 15% |
341 Properties |
| 1997 | £69,502 | -6% |
346 Properties |
| 1996 | £73,495 | 22% |
232 Properties |
| 1995 | £57,067 | - |
206 Properties |
Property Price per Property Type in Glastonbury
Here you can find historic sold price data in order to help with your property search.
The average Property Paid Price for specific property types in the last three years are:
| Property Type | Average Sold Price | Sold Properties |
|---|---|---|
| Semi Detached House | £289,873.00 | 136 Semi Detached Houses |
| Terraced House | £253,238.00 | 189 Terraced Houses |
| Detached House | £500,598.00 | 259 Detached Houses |
| Flat | £134,431.00 | 109 Flats |