
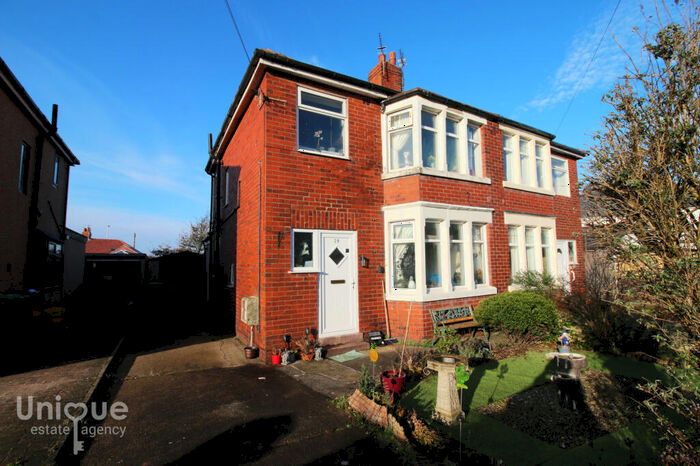
Houses for sale & to rent in Thornton-cleveleys, Blackpool
House Prices in Thornton-cleveleys
Properties in Thornton-cleveleys have an average house price of £158,377.00 and had 849 Property Transactions within the last 3 years.¹
Thornton-cleveleys is an area in Blackpool with 5,700 households², where the most expensive property was sold for £530,000.00.
Properties for sale in Thornton-cleveleys


Neighbourhoods in Thornton-cleveleys
Navigate through our locations to find the location of your next house in Thornton-cleveleys, Blackpool for sale or to rent.
Transport in Thornton-cleveleys
Please see below transportation links in this area:

- FAQ
- Price Paid By Year
- Property Type Price
Frequently asked questions about Thornton-cleveleys
What is the average price for a property for sale in Thornton-cleveleys?
The average price for a property for sale in Thornton-cleveleys is £158,377. This amount is 16% higher than the average price in Blackpool. There are 2,255 property listings for sale in Thornton-cleveleys.
What locations have the most expensive properties for sale in Thornton-cleveleys?
The locations with the most expensive properties for sale in Thornton-cleveleys are Ingthorpe at an average of £230,666 and Norbreck at an average of £174,781.
What locations have the most affordable properties for sale in Thornton-cleveleys?
The location with the most affordable properties for sale in Thornton-cleveleys is Anchorsholme at an average of £143,508.
Which train stations are available in or near Thornton-cleveleys?
Some of the train stations available in or near Thornton-cleveleys are Layton, Poulton-Le-Fylde and Blackpool North.
Property Price Paid in Thornton-cleveleys by Year
The average sold property price by year was:
| Year | Average Sold Price | Price Change |
Sold Properties
|
|---|---|---|---|
| 2024 | £163,745 | -1% |
21 Properties |
| 2023 | £165,734 | 1% |
217 Properties |
| 2022 | £164,236 | 10% |
289 Properties |
| 2021 | £147,811 | 5% |
322 Properties |
| 2020 | £139,774 | 6% |
236 Properties |
| 2019 | £131,989 | -6% |
262 Properties |
| 2018 | £140,177 | 10% |
253 Properties |
| 2017 | £126,078 | -1% |
282 Properties |
| 2016 | £127,024 | 6% |
280 Properties |
| 2015 | £119,242 | -1% |
251 Properties |
| 2014 | £120,134 | 4% |
247 Properties |
| 2013 | £115,144 | 3% |
249 Properties |
| 2012 | £112,033 | -6% |
174 Properties |
| 2011 | £119,036 | -4% |
173 Properties |
| 2010 | £124,081 | -1% |
167 Properties |
| 2009 | £125,159 | -8% |
146 Properties |
| 2008 | £135,724 | -6% |
149 Properties |
| 2007 | £144,450 | 5% |
300 Properties |
| 2006 | £137,564 | 4% |
379 Properties |
| 2005 | £132,025 | 9% |
250 Properties |
| 2004 | £120,205 | 19% |
366 Properties |
| 2003 | £97,169 | 18% |
352 Properties |
| 2002 | £79,249 | 16% |
362 Properties |
| 2001 | £66,509 | 6% |
398 Properties |
| 2000 | £62,315 | 1% |
319 Properties |
| 1999 | £61,553 | 10% |
356 Properties |
| 1998 | £55,383 | 10% |
344 Properties |
| 1997 | £49,823 | 5% |
342 Properties |
| 1996 | £47,322 | -5% |
297 Properties |
| 1995 | £49,485 | - |
215 Properties |
Property Price per Property Type in Thornton-cleveleys
Here you can find historic sold price data in order to help with your property search.
The average Property Paid Price for specific property types in the last three years are:
| Property Type | Average Sold Price | Sold Properties |
|---|---|---|
| Flat | £92,015.00 | 88 Flats |
| Semi Detached House | £155,203.00 | 558 Semi Detached Houses |
| Terraced House | £131,458.00 | 92 Terraced Houses |
| Detached House | £249,255.00 | 111 Detached Houses |