
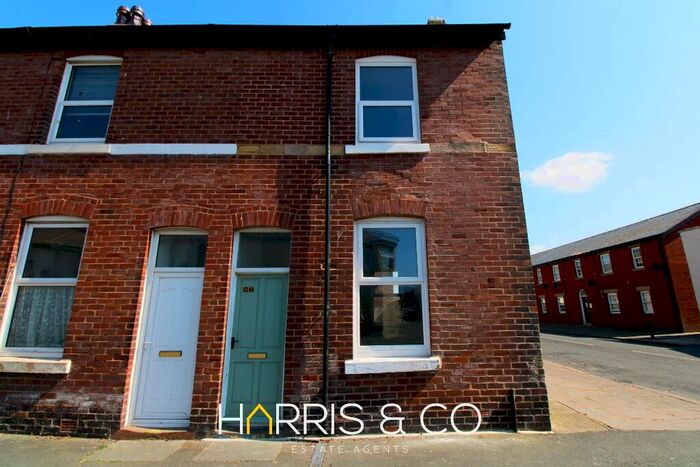
Houses for sale & to rent in Fleetwood, Lancashire
House Prices in Fleetwood
Properties in Fleetwood have an average house price of £137,414.00 and had 1,291 Property Transactions within the last 3 years.¹
Fleetwood is an area in Lancashire with 11,151 households², where the most expensive property was sold for £725,000.00.
Properties for sale in Fleetwood


Neighbourhoods in Fleetwood
Navigate through our locations to find the location of your next house in Fleetwood, Lancashire for sale or to rent.
Transport in Fleetwood
Please see below transportation links in this area:
-
 Poulton-Le-Fylde Station
 -
Layton Station
-
Blackpool North Station
-
Blackpool South Station
-
Blackpool Pleasure Beach Station
-
Heysham Port Station
-
Squires Gate Station
- FAQ
- Price Paid By Year
- Property Type Price
Frequently asked questions about Fleetwood
What is the average price for a property for sale in Fleetwood?
The average price for a property for sale in Fleetwood is £137,414. This amount is 37% lower than the average price in Lancashire. There are 2,279 property listings for sale in Fleetwood.
What locations have the most expensive properties for sale in Fleetwood?
The locations with the most expensive properties for sale in Fleetwood are Rossall at an average of £171,465, Park at an average of £155,078 and Warren at an average of £154,358.
What locations have the most affordable properties for sale in Fleetwood?
The locations with the most affordable properties for sale in Fleetwood are Pharos at an average of £110,650 and Mount at an average of £119,214.
Which train stations are available in or near Fleetwood?
Some of the train stations available in or near Fleetwood are Poulton-Le-Fylde, Layton and Blackpool North.
Property Price Paid in Fleetwood by Year
The average sold property price by year was:
| Year | Average Sold Price | Price Change |
Sold Properties
|
|---|---|---|---|
| 2024 | £152,253 | 8% |
31 Properties |
| 2023 | £140,035 | 1% |
265 Properties |
| 2022 | £138,000 | 2% |
434 Properties |
| 2021 | £134,902 | 10% |
561 Properties |
| 2020 | £121,568 | -6% |
388 Properties |
| 2019 | £128,322 | 8% |
384 Properties |
| 2018 | £118,560 | -2% |
416 Properties |
| 2017 | £120,678 | 1% |
404 Properties |
| 2016 | £119,697 | 6% |
379 Properties |
| 2015 | £112,207 | -2% |
401 Properties |
| 2014 | £114,316 | 6% |
404 Properties |
| 2013 | £107,618 | -2% |
290 Properties |
| 2012 | £109,995 | 2% |
245 Properties |
| 2011 | £108,172 | 5% |
287 Properties |
| 2010 | £102,942 | -3% |
196 Properties |
| 2009 | £106,507 | -5% |
206 Properties |
| 2008 | £112,291 | -8% |
278 Properties |
| 2007 | £121,457 | 3% |
544 Properties |
| 2006 | £117,994 | 6% |
575 Properties |
| 2005 | £110,422 | 13% |
503 Properties |
| 2004 | £96,522 | 22% |
571 Properties |
| 2003 | £75,516 | 23% |
626 Properties |
| 2002 | £58,146 | 12% |
692 Properties |
| 2001 | £51,348 | 3% |
650 Properties |
| 2000 | £49,650 | 6% |
548 Properties |
| 1999 | £46,582 | 3% |
551 Properties |
| 1998 | £45,331 | -1% |
484 Properties |
| 1997 | £45,890 | 6% |
480 Properties |
| 1996 | £43,148 | 1% |
449 Properties |
| 1995 | £42,587 | - |
345 Properties |
Property Price per Property Type in Fleetwood
Here you can find historic sold price data in order to help with your property search.
The average Property Paid Price for specific property types in the last three years are:
| Property Type | Average Sold Price | Sold Properties |
|---|---|---|
| Semi Detached House | £157,280.00 | 358 Semi Detached Houses |
| Terraced House | £110,819.00 | 694 Terraced Houses |
| Detached House | £243,645.00 | 156 Detached Houses |
| Flat | £74,428.00 | 83 Flats |