
Houses for sale & to rent in Delabole, Cornwall
House Prices in Delabole
Properties in Delabole have an average house price of £269,218.00 and had 89 Property Transactions within the last 3 years.¹
Delabole is an area in Cornwall with 834 households², where the most expensive property was sold for £825,000.00.
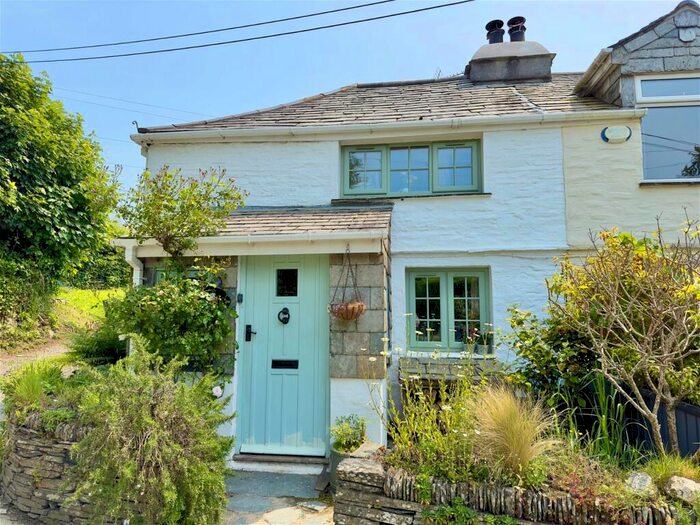
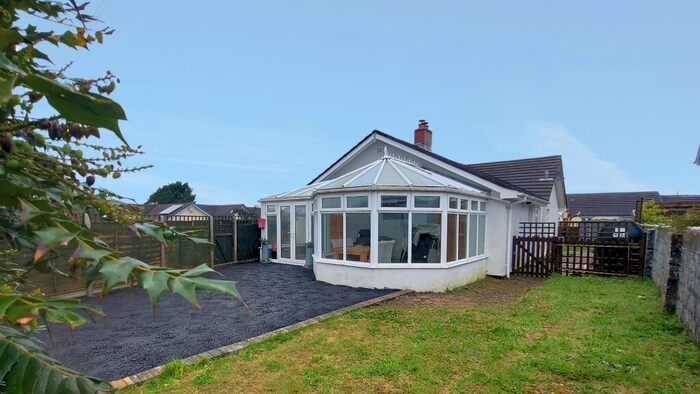
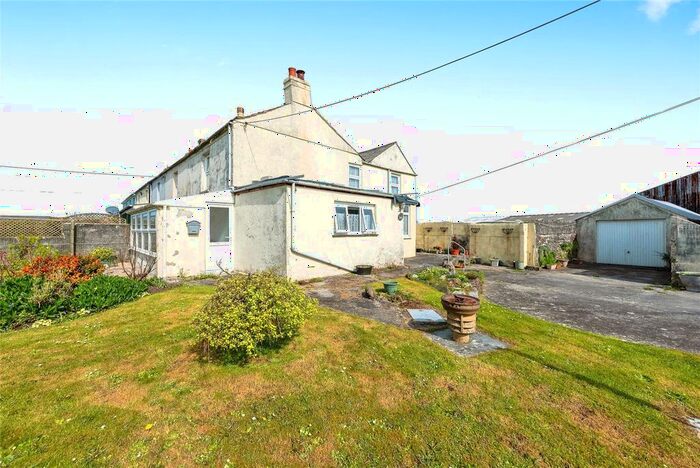
Properties for sale in Delabole


Neighbourhoods in Delabole
Navigate through our locations to find the location of your next house in Delabole, Cornwall for sale or to rent.
Transport in Delabole
Please see below transportation links in this area:
-
 Bodmin Parkway Station
 -
Roche Station
-
Lostwithiel Station
-
Bugle Station
-
Luxulyan Station
-
Coombe Junction Halt Station
-
Liskeard Station
-
St.Columb Road Station
-
St.Keyne Wishing Well Halt Station
-
Par Station
- FAQ
- Price Paid By Year
- Property Type Price
Frequently asked questions about Delabole
What is the average price for a property for sale in Delabole?
The average price for a property for sale in Delabole is £269,218. This amount is 25% lower than the average price in Cornwall. There are 909 property listings for sale in Delabole.
What locations have the most expensive properties for sale in Delabole?
The locations with the most expensive properties for sale in Delabole are Tintagel at an average of £502,500 and Camelford at an average of £330,666.
What locations have the most affordable properties for sale in Delabole?
The location with the most affordable properties for sale in Delabole is St Teath And St Breward at an average of £261,469.
Which train stations are available in or near Delabole?
Some of the train stations available in or near Delabole are Bodmin Parkway, Roche and Lostwithiel.
Property Price Paid in Delabole by Year
The average sold property price by year was:
| Year | Average Sold Price | Price Change |
Sold Properties
|
|---|---|---|---|
| 2023 | £321,610 | 22% |
20 Properties |
| 2022 | £249,325 | -4% |
33 Properties |
| 2021 | £258,347 | 16% |
36 Properties |
| 2020 | £217,143 | 5% |
31 Properties |
| 2019 | £205,594 | -1% |
44 Properties |
| 2018 | £206,634 | -6% |
33 Properties |
| 2017 | £218,352 | 22% |
45 Properties |
| 2016 | £170,203 | -18% |
31 Properties |
| 2015 | £201,601 | 4% |
53 Properties |
| 2014 | £193,528 | -3% |
35 Properties |
| 2013 | £199,156 | 11% |
31 Properties |
| 2012 | £177,146 | 15% |
30 Properties |
| 2011 | £150,255 | -8% |
20 Properties |
| 2010 | £162,955 | 4% |
26 Properties |
| 2009 | £156,619 | -23% |
33 Properties |
| 2008 | £192,609 | -6% |
22 Properties |
| 2007 | £203,790 | 15% |
47 Properties |
| 2006 | £173,397 | 11% |
45 Properties |
| 2005 | £154,366 | -13% |
27 Properties |
| 2004 | £175,171 | 30% |
39 Properties |
| 2003 | £122,532 | 10% |
46 Properties |
| 2002 | £109,695 | 25% |
69 Properties |
| 2001 | £82,438 | 18% |
48 Properties |
| 2000 | £67,698 | 16% |
45 Properties |
| 1999 | £56,948 | -3% |
43 Properties |
| 1998 | £58,480 | 6% |
36 Properties |
| 1997 | £54,794 | 9% |
43 Properties |
| 1996 | £49,882 | 14% |
38 Properties |
| 1995 | £43,022 | - |
26 Properties |
Property Price per Property Type in Delabole
Here you can find historic sold price data in order to help with your property search.
The average Property Paid Price for specific property types in the last three years are:
| Property Type | Average Sold Price | Sold Properties |
|---|---|---|
| Semi Detached House | £249,289.00 | 20 Semi Detached Houses |
| Terraced House | £202,839.00 | 28 Terraced Houses |
| Detached House | £357,032.00 | 35 Detached Houses |
| Flat | £133,166.00 | 6 Flats |