
Houses for sale & to rent in Wadebridge, Cornwall
House Prices in Wadebridge
Properties in Wadebridge have an average house price of £544,658.00 and had 781 Property Transactions within the last 3 years.¹
Wadebridge is an area in Cornwall with 5,197 households², where the most expensive property was sold for £8,125,000.00.
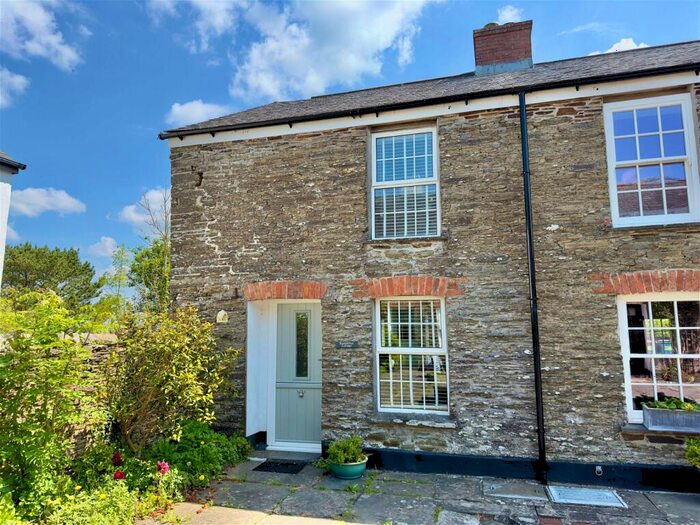
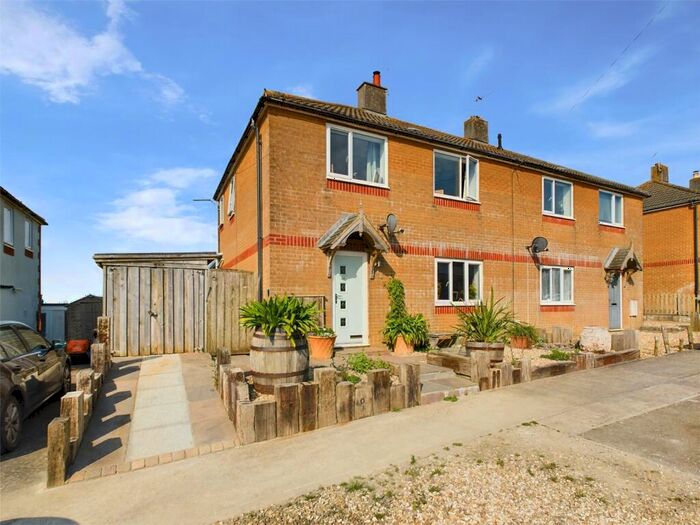
Properties for sale in Wadebridge


Neighbourhoods in Wadebridge
Navigate through our locations to find the location of your next house in Wadebridge, Cornwall for sale or to rent.
Transport in Wadebridge
Please see below transportation links in this area:

- FAQ
- Price Paid By Year
- Property Type Price
Frequently asked questions about Wadebridge
What is the average price for a property for sale in Wadebridge?
The average price for a property for sale in Wadebridge is £544,658. This amount is 45% higher than the average price in Cornwall. There are 3,897 property listings for sale in Wadebridge.
What locations have the most expensive properties for sale in Wadebridge?
The locations with the most expensive properties for sale in Wadebridge are St Minver And St Endellion at an average of £1,067,171 and St Issey And St Tudy at an average of £414,660.
What locations have the most affordable properties for sale in Wadebridge?
The locations with the most affordable properties for sale in Wadebridge are Wadebridge West at an average of £303,714 and Wadebridge East at an average of £409,983.
Which train stations are available in or near Wadebridge?
Some of the train stations available in or near Wadebridge are Roche, St.Columb Road and Bugle.
Property Price Paid in Wadebridge by Year
The average sold property price by year was:
| Year | Average Sold Price | Price Change |
Sold Properties
|
|---|---|---|---|
| 2024 | £502,988 | -24% |
9 Properties |
| 2023 | £623,167 | 9% |
180 Properties |
| 2022 | £568,004 | 14% |
247 Properties |
| 2021 | £488,069 | -5% |
345 Properties |
| 2020 | £510,358 | 7% |
241 Properties |
| 2019 | £474,372 | 15% |
273 Properties |
| 2018 | £402,016 | 9% |
311 Properties |
| 2017 | £366,467 | 3% |
269 Properties |
| 2016 | £356,491 | -1% |
333 Properties |
| 2015 | £361,471 | 9% |
308 Properties |
| 2014 | £327,466 | -16% |
296 Properties |
| 2013 | £378,855 | 10% |
270 Properties |
| 2012 | £339,251 | 7% |
228 Properties |
| 2011 | £316,523 | -13% |
204 Properties |
| 2010 | £357,641 | 14% |
194 Properties |
| 2009 | £306,011 | 5% |
206 Properties |
| 2008 | £291,560 | -23% |
220 Properties |
| 2007 | £359,394 | 20% |
311 Properties |
| 2006 | £288,172 | 6% |
290 Properties |
| 2005 | £269,700 | 11% |
256 Properties |
| 2004 | £239,898 | 16% |
275 Properties |
| 2003 | £202,356 | 20% |
307 Properties |
| 2002 | £162,139 | 23% |
340 Properties |
| 2001 | £125,564 | 20% |
402 Properties |
| 2000 | £99,852 | 3% |
423 Properties |
| 1999 | £96,557 | 4% |
385 Properties |
| 1998 | £92,661 | 14% |
324 Properties |
| 1997 | £79,345 | 5% |
320 Properties |
| 1996 | £75,285 | 13% |
284 Properties |
| 1995 | £65,479 | - |
186 Properties |
Property Price per Property Type in Wadebridge
Here you can find historic sold price data in order to help with your property search.
The average Property Paid Price for specific property types in the last three years are:
| Property Type | Average Sold Price | Sold Properties |
|---|---|---|
| Semi Detached House | £352,315.00 | 150 Semi Detached Houses |
| Terraced House | £351,348.00 | 170 Terraced Houses |
| Detached House | £843,621.00 | 322 Detached Houses |
| Flat | £296,083.00 | 139 Flats |