
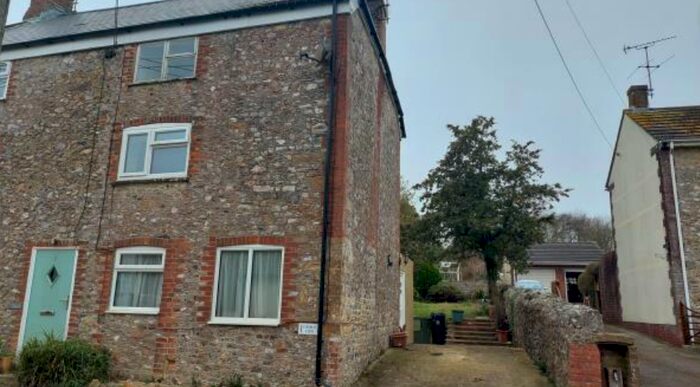
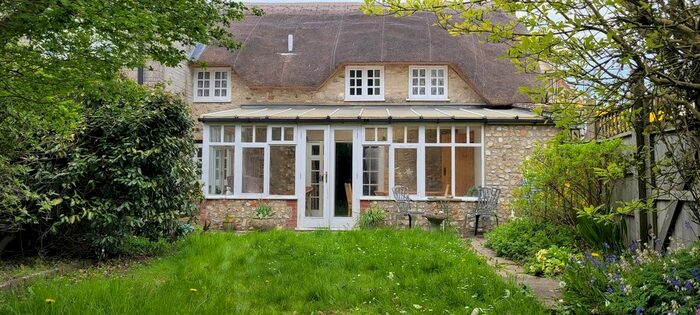
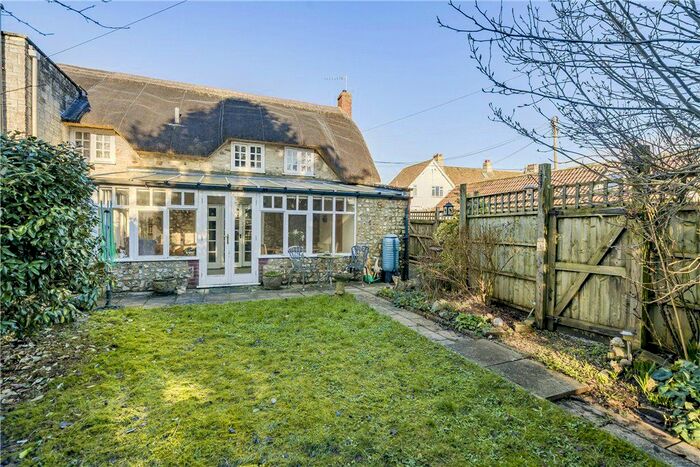
Houses for sale & to rent in Chard, Dorset
House Prices in Chard
Properties in Chard have an average house price of £538,712.00 and had 25 Property Transactions within the last 3 years.¹
Chard is an area in Dorset with 293 households², where the most expensive property was sold for £1,950,000.00.
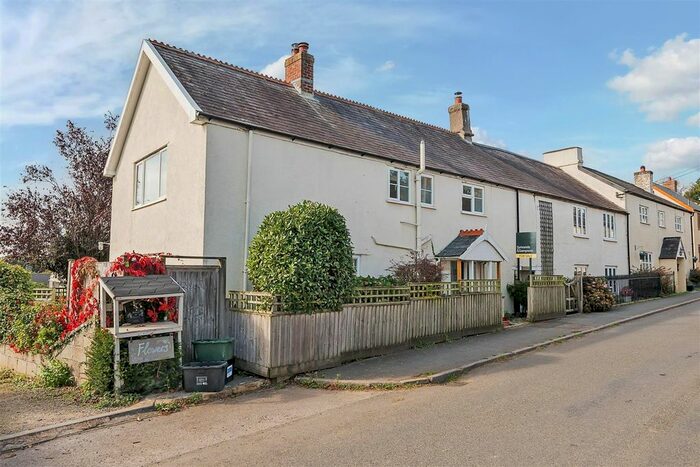
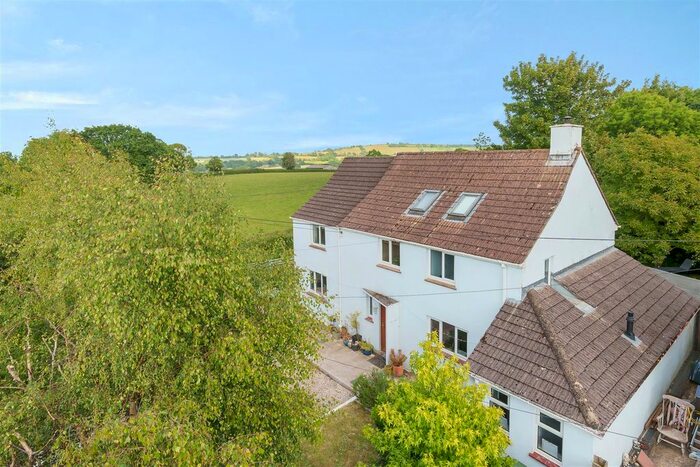
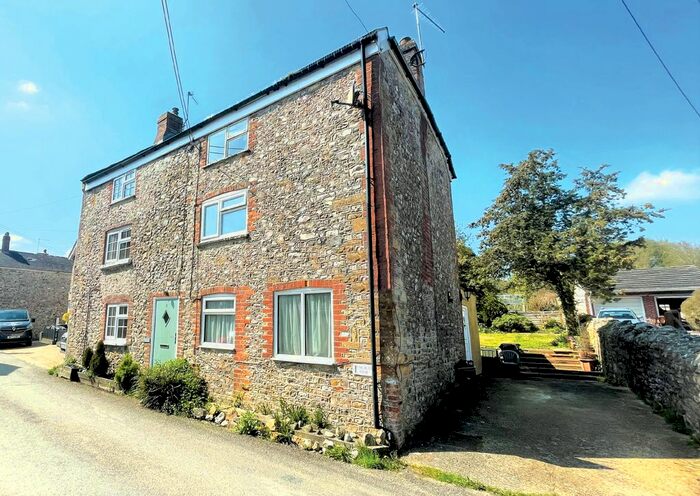
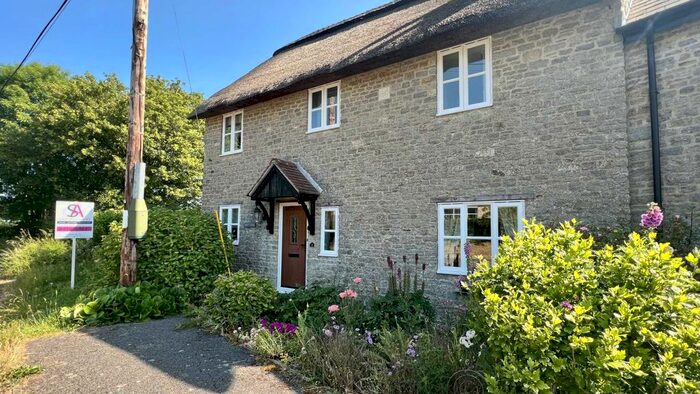
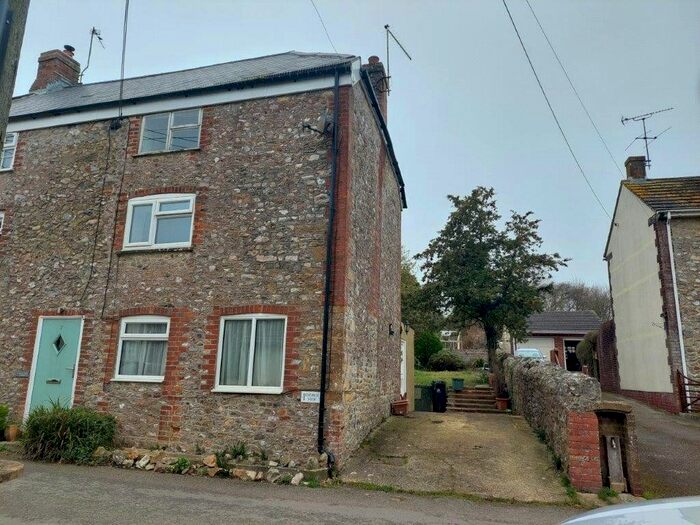
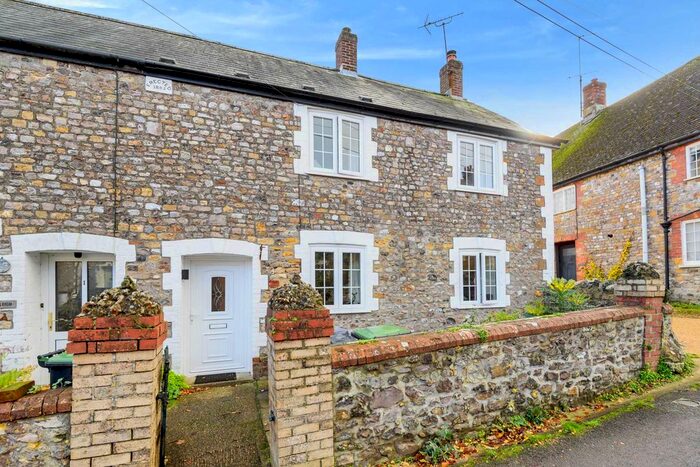
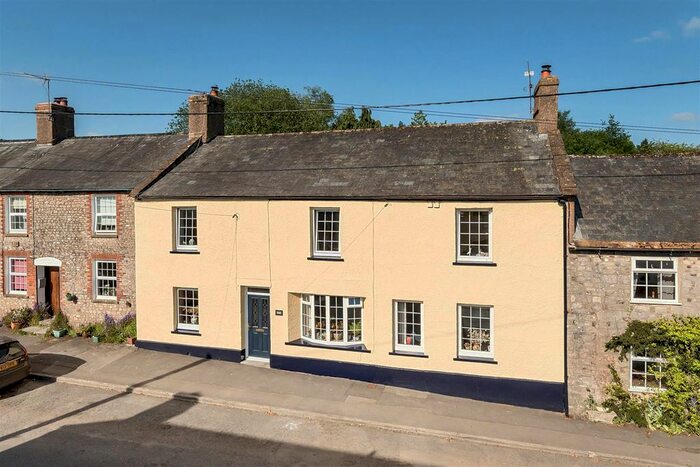
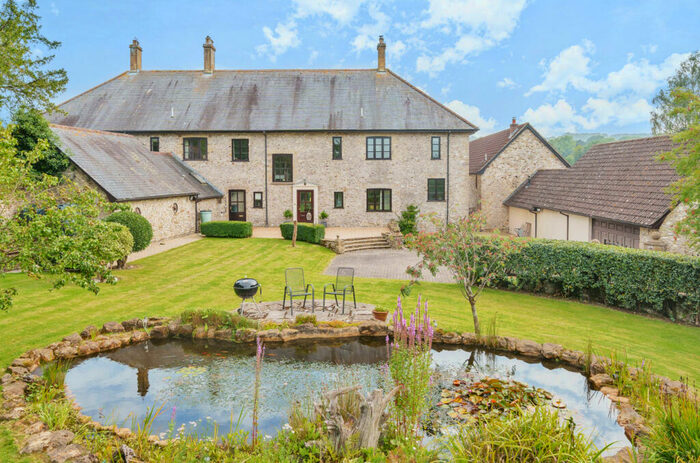
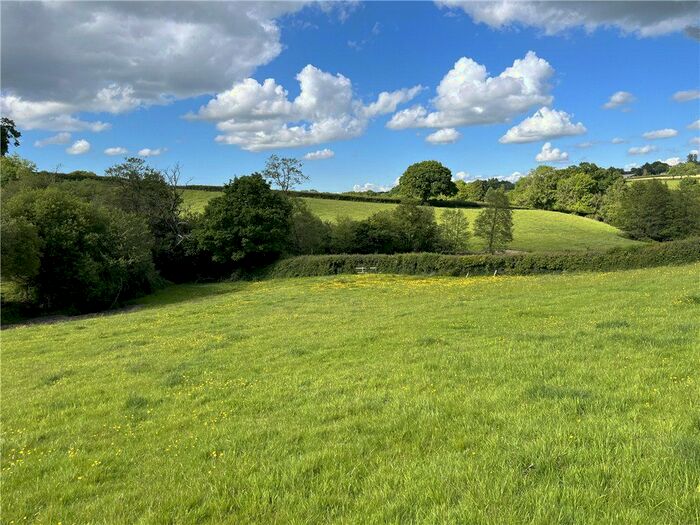
Properties for sale in Chard


Previously listed properties in Chard


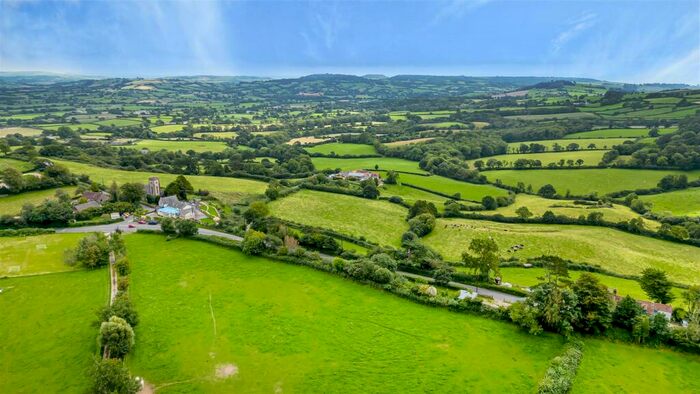
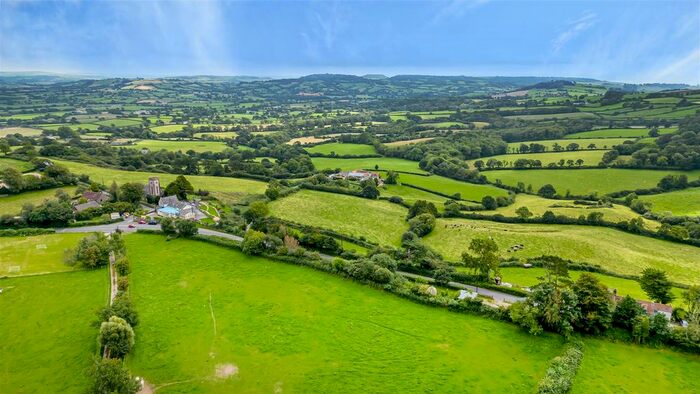


Neighbourhoods in Chard
Navigate through our locations to find the location of your next house in Chard, Dorset for sale or to rent.
Transport in Chard
Please see below transportation links in this area:
-
 Axminster Station
 -
Crewkerne Station
-
Honiton Station
-
Yeovil Junction Station
-
Chetnole Station
-
Yeovil Pen Mill Station
-
Maiden Newton Station
-
Yetminster Station
- FAQ
- Price Paid By Year
- Property Type Price
Frequently asked questions about Chard
What is the average price for a property for sale in Chard?
The average price for a property for sale in Chard is £538,712. This amount is 30% higher than the average price in Dorset. There are 103 property listings for sale in Chard.
What locations have the most expensive properties for sale in Chard?
The location with the most expensive properties for sale in Chard is Marshwood Vale at an average of £546,371.
What locations have the most affordable properties for sale in Chard?
The location with the most affordable properties for sale in Chard is Broadwindsor at an average of £482,553.
Which train stations are available in or near Chard?
Some of the train stations available in or near Chard are Axminster, Crewkerne and Honiton.
Property Price Paid in Chard by Year
The average sold property price by year was:
| Year | Average Sold Price | Price Change |
Sold Properties
|
|---|---|---|---|
| 2024 | £440,000 | -42% |
1 Property |
| 2023 | £623,188 | -16% |
8 Properties |
| 2022 | £724,859 | 49% |
6 Properties |
| 2021 | £369,316 | -25% |
10 Properties |
| 2020 | £461,277 | 11% |
9 Properties |
| 2019 | £410,755 | 24% |
9 Properties |
| 2018 | £310,166 | 15% |
3 Properties |
| 2017 | £262,450 | -14% |
11 Properties |
| 2016 | £298,567 | -46% |
14 Properties |
| 2015 | £436,328 | -28% |
16 Properties |
| 2014 | £558,000 | 42% |
8 Properties |
| 2013 | £322,812 | 7% |
8 Properties |
| 2012 | £301,000 | -3% |
3 Properties |
| 2011 | £308,704 | 5% |
11 Properties |
| 2010 | £292,310 | -8% |
10 Properties |
| 2009 | £315,285 | 31% |
7 Properties |
| 2008 | £217,750 | -76% |
4 Properties |
| 2007 | £384,204 | 22% |
12 Properties |
| 2006 | £300,160 | 25% |
15 Properties |
| 2005 | £224,900 | -32% |
5 Properties |
| 2004 | £296,090 | 6% |
11 Properties |
| 2003 | £277,000 | 27% |
5 Properties |
| 2002 | £201,928 | 18% |
21 Properties |
| 2001 | £165,225 | 7% |
10 Properties |
| 2000 | £154,040 | 24% |
22 Properties |
| 1999 | £116,312 | 11% |
29 Properties |
| 1998 | £103,383 | -8% |
15 Properties |
| 1997 | £112,011 | 42% |
17 Properties |
| 1996 | £64,650 | -22% |
10 Properties |
| 1995 | £78,666 | - |
3 Properties |
Property Price per Property Type in Chard
Here you can find historic sold price data in order to help with your property search.
The average Property Paid Price for specific property types in the last three years are:
| Property Type | Average Sold Price | Sold Properties |
|---|---|---|
| Semi Detached House | £309,221.00 | 12 Semi Detached Houses |
| Detached House | £750,550.00 | 13 Detached Houses |