
Houses for sale & to rent in Chard, Somerset
House Prices in Chard
Properties in Chard have an average house price of £291,266.00 and had 1,025 Property Transactions within the last 3 years.¹
Chard is an area in Somerset with 8,557 households², where the most expensive property was sold for £1,850,000.00.
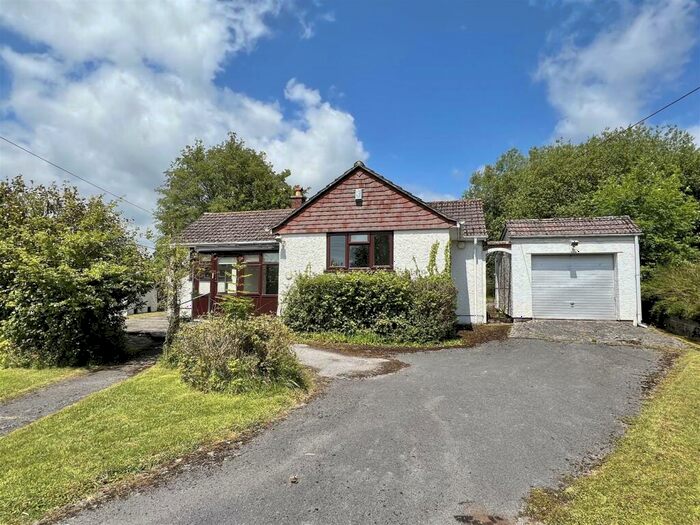
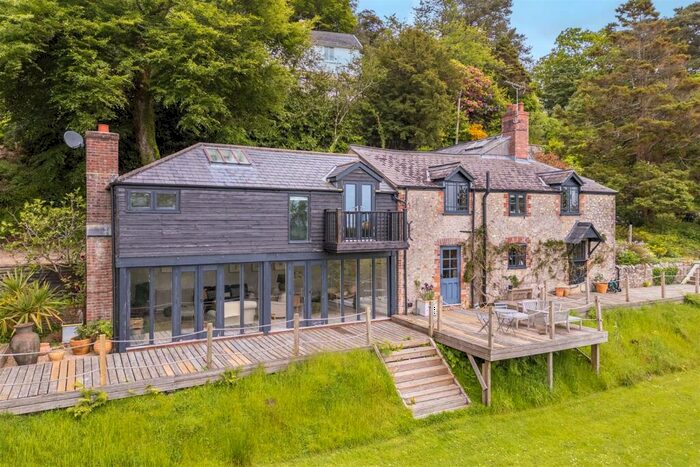
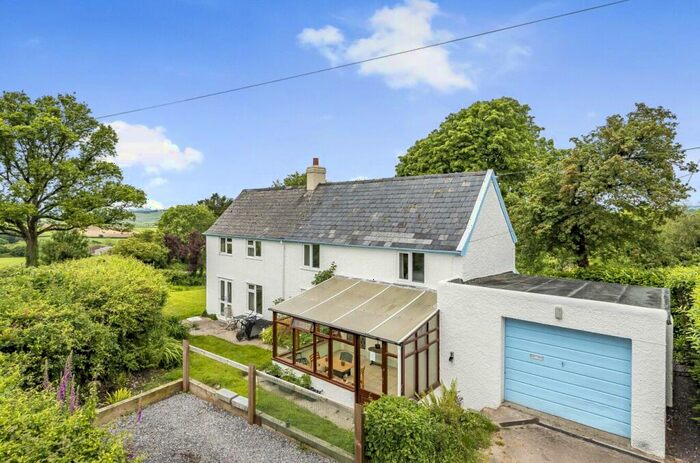
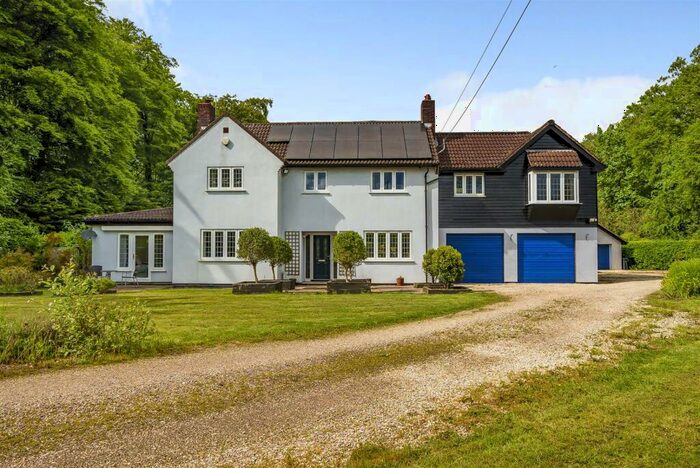
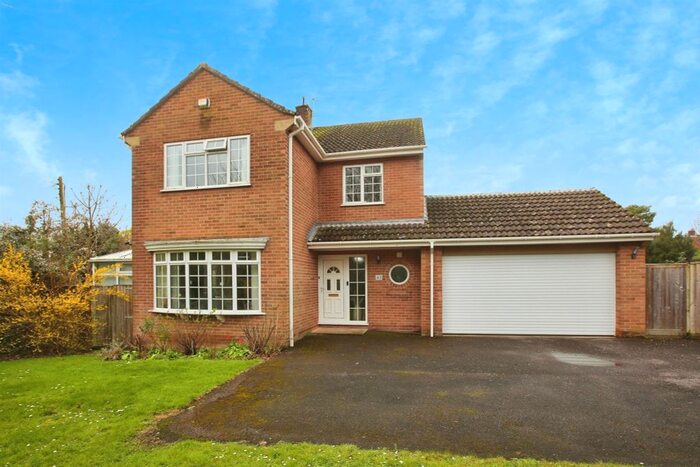
Properties for sale in Chard


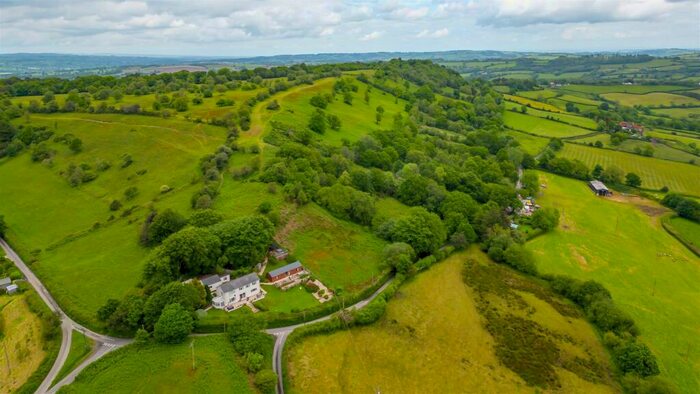


Neighbourhoods in Chard
Navigate through our locations to find the location of your next house in Chard, Somerset for sale or to rent.
Transport in Chard
Please see below transportation links in this area:

- FAQ
- Price Paid By Year
- Property Type Price
Frequently asked questions about Chard
What is the average price for a property for sale in Chard?
The average price for a property for sale in Chard is £291,266. This amount is 10% lower than the average price in Somerset. There are 3,377 property listings for sale in Chard.
What locations have the most expensive properties for sale in Chard?
The locations with the most expensive properties for sale in Chard are Blackdown at an average of £511,752, Windwhistle at an average of £439,815 and Blackdown & Tatworth at an average of £357,609.
What locations have the most affordable properties for sale in Chard?
The locations with the most affordable properties for sale in Chard are Chard Holyrood at an average of £221,444, Chard Avishayes at an average of £231,243 and Chard Crimchard at an average of £245,561.
Which train stations are available in or near Chard?
Some of the train stations available in or near Chard are Axminster, Crewkerne and Honiton.
Property Price Paid in Chard by Year
The average sold property price by year was:
| Year | Average Sold Price | Price Change |
Sold Properties
|
|---|---|---|---|
| 2024 | £275,951 | -12% |
26 Properties |
| 2023 | £309,590 | 2% |
224 Properties |
| 2022 | £303,922 | 10% |
331 Properties |
| 2021 | £273,482 | 9% |
444 Properties |
| 2020 | £248,360 | -0,3% |
325 Properties |
| 2019 | £249,092 | 5% |
343 Properties |
| 2018 | £236,240 | -1% |
343 Properties |
| 2017 | £238,843 | 13% |
384 Properties |
| 2016 | £208,152 | 2% |
387 Properties |
| 2015 | £204,815 | 1% |
378 Properties |
| 2014 | £202,309 | 3% |
389 Properties |
| 2013 | £196,949 | 7% |
336 Properties |
| 2012 | £182,884 | -2% |
293 Properties |
| 2011 | £186,307 | -6% |
265 Properties |
| 2010 | £197,495 | 2% |
285 Properties |
| 2009 | £193,669 | 2% |
246 Properties |
| 2008 | £188,832 | -9% |
253 Properties |
| 2007 | £206,123 | 8% |
485 Properties |
| 2006 | £189,300 | 3% |
470 Properties |
| 2005 | £184,121 | 8% |
372 Properties |
| 2004 | £168,573 | 15% |
441 Properties |
| 2003 | £142,642 | 14% |
497 Properties |
| 2002 | £122,635 | 16% |
478 Properties |
| 2001 | £103,035 | 8% |
460 Properties |
| 2000 | £94,518 | 16% |
349 Properties |
| 1999 | £79,533 | 10% |
473 Properties |
| 1998 | £71,520 | 8% |
452 Properties |
| 1997 | £65,741 | 8% |
453 Properties |
| 1996 | £60,354 | - |
387 Properties |
| 1995 | £60,368 | - |
338 Properties |
Property Price per Property Type in Chard
Here you can find historic sold price data in order to help with your property search.
The average Property Paid Price for specific property types in the last three years are:
| Property Type | Average Sold Price | Sold Properties |
|---|---|---|
| Semi Detached House | £243,697.00 | 250 Semi Detached Houses |
| Terraced House | £196,228.00 | 302 Terraced Houses |
| Detached House | £420,063.00 | 407 Detached Houses |
| Flat | £112,074.00 | 66 Flats |