
Houses for sale & to rent in Greenford, Ealing London Borough
House Prices in Greenford
Properties in this part of Greenford within the Ealing London Borough have an average house price of £479,717.00 and had 1,219 Property Transactions within the last 3 years.¹ This area has 17,381 households² , where the most expensive property was sold for £1,663,078.00.
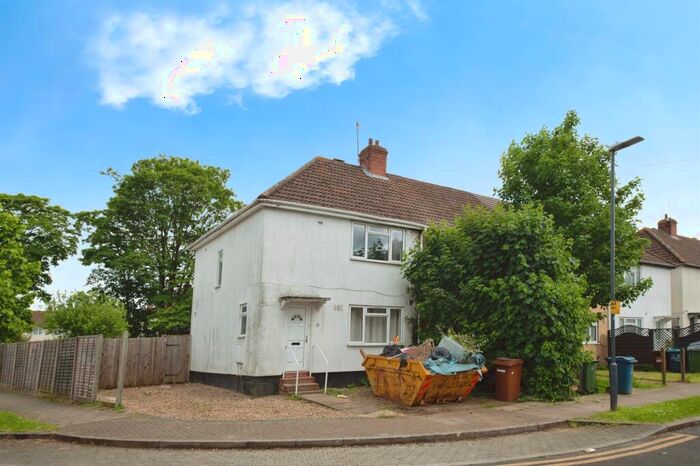
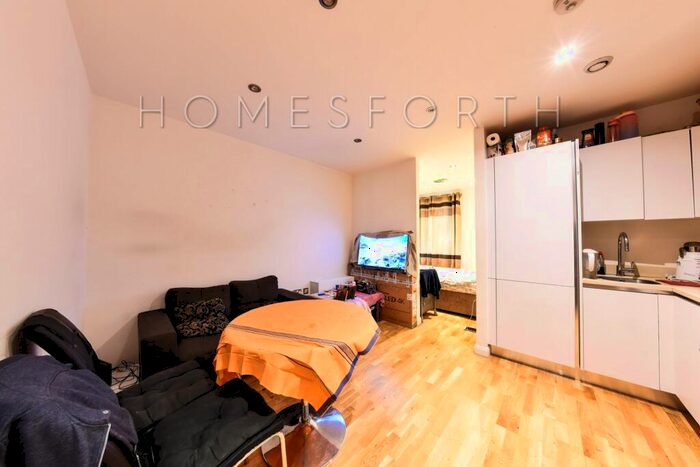
Properties for sale in Greenford


Neighbourhoods in Greenford
Navigate through our locations to find the location of your next house in Greenford, Ealing London Borough for sale or to rent.
Transport in Greenford
Please see below transportation links in this area:
-

 Greenford Station
 -
South Greenford Station
-
Perivale Station
-
Castle Bar Park Station
-
Sudbury Hill Station
-
Sudbury Town Station
-
Sudbury Hill Harrow Station
-
Northolt Station
-
Sudbury and Harrow Road Station
-
Northolt Park Station
- FAQ
- Price Paid By Year
- Property Type Price
Frequently asked questions about Greenford
What is the average price for a property for sale in Greenford?
The average price for a property for sale in Greenford is £479,717. This amount is 28% lower than the average price in Ealing London Borough. There are more than 10,000 property listings for sale in Greenford.
What locations have the most expensive properties for sale in Greenford?
The locations with the most expensive properties for sale in Greenford are North Greenford at an average of £524,236, Lady Margaret at an average of £511,026 and Perivale at an average of £511,017.
What locations have the most affordable properties for sale in Greenford?
The locations with the most affordable properties for sale in Greenford are Dormers Wells at an average of £415,306, Greenford Broadway at an average of £431,003 and Greenford Green at an average of £457,240.
Which train stations are available in or near Greenford?
Some of the train stations available in or near Greenford are Greenford, South Greenford and Castle Bar Park.
Which tube stations are available in or near Greenford?
Some of the tube stations available in or near Greenford are Greenford, Perivale and Sudbury Hill.
Property Price Paid in Greenford by Year
The average sold property price by year was:
| Year | Average Sold Price | Price Change |
Sold Properties
|
|---|---|---|---|
| 2024 | £474,892 | -2% |
19 Properties |
| 2023 | £483,839 | - |
275 Properties |
| 2022 | £483,699 | 2% |
434 Properties |
| 2021 | £474,076 | 5% |
491 Properties |
| 2020 | £450,308 | 7% |
359 Properties |
| 2019 | £419,857 | -3% |
316 Properties |
| 2018 | £430,541 | 2% |
462 Properties |
| 2017 | £421,234 | 9% |
398 Properties |
| 2016 | £384,932 | 5% |
431 Properties |
| 2015 | £366,579 | 9% |
452 Properties |
| 2014 | £332,230 | 14% |
455 Properties |
| 2013 | £285,932 | 8% |
461 Properties |
| 2012 | £263,355 | 0,3% |
353 Properties |
| 2011 | £262,439 | 4% |
356 Properties |
| 2010 | £250,742 | 6% |
400 Properties |
| 2009 | £235,972 | -11% |
300 Properties |
| 2008 | £261,023 | -0,1% |
397 Properties |
| 2007 | £261,312 | 10% |
831 Properties |
| 2006 | £234,480 | 1% |
880 Properties |
| 2005 | £232,532 | 4% |
608 Properties |
| 2004 | £222,875 | 8% |
846 Properties |
| 2003 | £204,979 | 13% |
839 Properties |
| 2002 | £178,310 | 16% |
914 Properties |
| 2001 | £149,432 | 13% |
877 Properties |
| 2000 | £129,908 | 16% |
782 Properties |
| 1999 | £109,729 | 13% |
838 Properties |
| 1998 | £95,947 | 10% |
840 Properties |
| 1997 | £85,908 | 15% |
796 Properties |
| 1996 | £73,344 | 3% |
686 Properties |
| 1995 | £70,964 | - |
578 Properties |
Property Price per Property Type in Greenford
Here you can find historic sold price data in order to help with your property search.
The average Property Paid Price for specific property types in the last three years are:
| Property Type | Average Sold Price | Sold Properties |
|---|---|---|
| Semi Detached House | £566,835.00 | 303 Semi Detached Houses |
| Terraced House | £522,196.00 | 574 Terraced Houses |
| Detached House | £602,740.00 | 39 Detached Houses |
| Flat | £296,293.00 | 303 Flats |