
Houses for sale & to rent in Northolt, Ealing London Borough
House Prices in Northolt
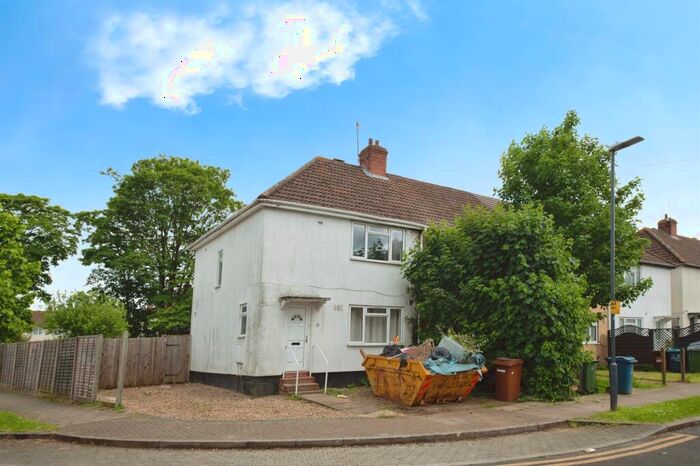
Properties in this part of Northolt within the Ealing London Borough have an average house price of £393,467.00 and had 1,028 Property Transactions within the last 3 years.¹ This area has 15,766 households² , where the most expensive property was sold for £1,100,000.00.
Properties for sale in Northolt


Neighbourhoods in Northolt
Navigate through our locations to find the location of your next house in Northolt, Ealing London Borough for sale or to rent.
Transport in Northolt
Please see below transportation links in this area:
-
 Northolt Station
 -
 Northolt Park Station
 -
Greenford Station
-
South Ruislip Station
-
South Greenford Station
-
South Harrow Station
-
Ruislip Gardens Station
-
Sudbury Hill Station
-
Sudbury Hill Harrow Station
-
Rayners Lane Station
- FAQ
- Price Paid By Year
- Property Type Price
Frequently asked questions about Northolt
What is the average price for a property for sale in Northolt?
The average price for a property for sale in Northolt is £393,467. This amount is 47% lower than the average price in Ealing London Borough. There are 6,965 property listings for sale in Northolt.
What locations have the most expensive properties for sale in Northolt?
The locations with the most expensive properties for sale in Northolt are Greenford Green at an average of £465,409, North Greenford at an average of £415,699 and Northolt Mandeville at an average of £410,063.
What locations have the most affordable properties for sale in Northolt?
The locations with the most affordable properties for sale in Northolt are Greenford Broadway at an average of £325,158 and Northolt West End at an average of £377,006.
Which train stations are available in or near Northolt?
Some of the train stations available in or near Northolt are Northolt Park, Greenford and South Ruislip.
Which tube stations are available in or near Northolt?
Some of the tube stations available in or near Northolt are Northolt, Greenford and South Ruislip.
Property Price Paid in Northolt by Year
The average sold property price by year was:
| Year | Average Sold Price | Price Change |
Sold Properties
|
|---|---|---|---|
| 2024 | £339,821 | -18% |
14 Properties |
| 2023 | £401,661 | 0,2% |
246 Properties |
| 2022 | £400,981 | 4% |
344 Properties |
| 2021 | £384,388 | 7% |
424 Properties |
| 2020 | £358,763 | 2% |
259 Properties |
| 2019 | £351,059 | -4% |
341 Properties |
| 2018 | £364,663 | 4% |
358 Properties |
| 2017 | £349,410 | 4% |
415 Properties |
| 2016 | £333,878 | 11% |
408 Properties |
| 2015 | £298,453 | 14% |
454 Properties |
| 2014 | £257,883 | 12% |
410 Properties |
| 2013 | £227,577 | 5% |
364 Properties |
| 2012 | £216,334 | 4% |
352 Properties |
| 2011 | £208,664 | -3% |
316 Properties |
| 2010 | £215,025 | 7% |
374 Properties |
| 2009 | £198,947 | -11% |
309 Properties |
| 2008 | £220,210 | 3% |
409 Properties |
| 2007 | £213,199 | 8% |
849 Properties |
| 2006 | £195,571 | 2% |
817 Properties |
| 2005 | £190,709 | 3% |
764 Properties |
| 2004 | £185,273 | 5% |
744 Properties |
| 2003 | £175,261 | 17% |
860 Properties |
| 2002 | £146,028 | 19% |
754 Properties |
| 2001 | £118,775 | 13% |
797 Properties |
| 2000 | £103,241 | 11% |
691 Properties |
| 1999 | £91,769 | 20% |
725 Properties |
| 1998 | £73,868 | 7% |
706 Properties |
| 1997 | £68,672 | 12% |
611 Properties |
| 1996 | £60,133 | 3% |
480 Properties |
| 1995 | £58,145 | - |
392 Properties |
Property Price per Property Type in Northolt
Here you can find historic sold price data in order to help with your property search.
The average Property Paid Price for specific property types in the last three years are:
| Property Type | Average Sold Price | Sold Properties |
|---|---|---|
| Semi Detached House | £498,566.00 | 305 Semi Detached Houses |
| Terraced House | £444,875.00 | 297 Terraced Houses |
| Detached House | £674,714.00 | 14 Detached Houses |
| Flat | £269,047.00 | 412 Flats |