
Houses for sale & to rent in Barnoldswick, Lancashire
House Prices in Barnoldswick
Properties in Barnoldswick have an average house price of £174,217.00 and had 1,040 Property Transactions within the last 3 years.¹
Barnoldswick is an area in Lancashire with 7,498 households², where the most expensive property was sold for £1,591,105.00.
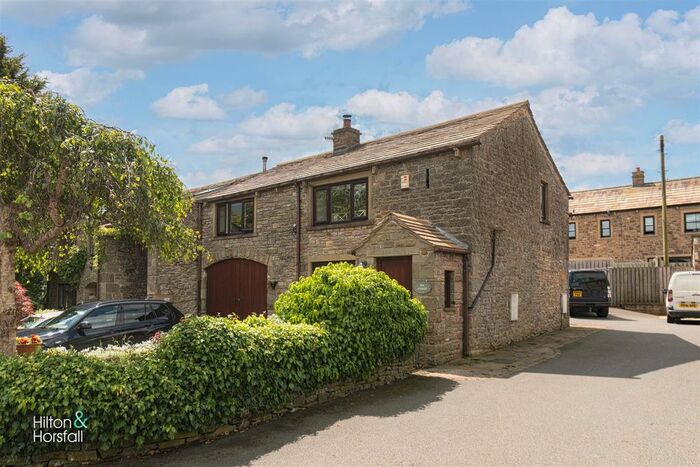
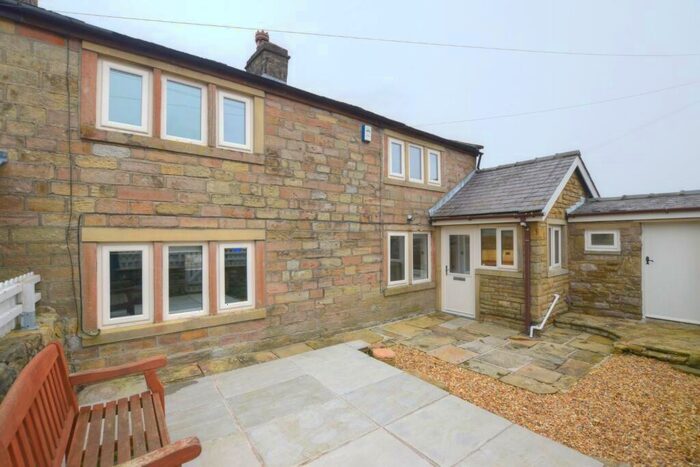
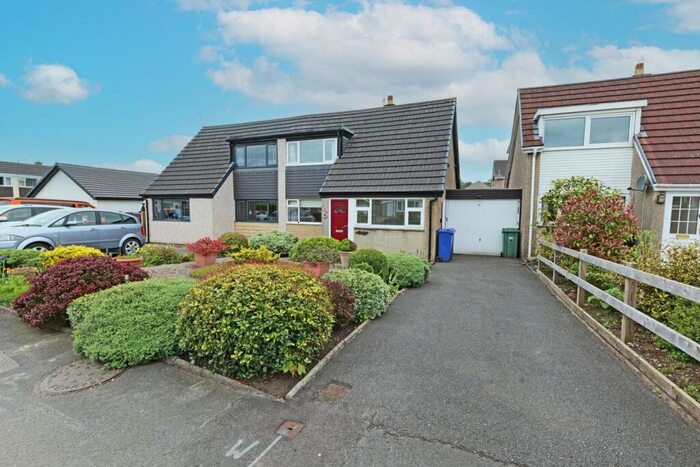
Properties for sale in Barnoldswick


Neighbourhoods in Barnoldswick
Navigate through our locations to find the location of your next house in Barnoldswick, Lancashire for sale or to rent.
Transport in Barnoldswick
Please see below transportation links in this area:
-
 Colne Station
 -
Gargrave Station
-
Nelson Station
-
Cononley Station
-
Skipton Station
-
Brierfield Station
-
Hellifield Station
-
Long Preston Station
-
Burnley Central Station
-
Burnley Barracks Station
- FAQ
- Price Paid By Year
- Property Type Price
Frequently asked questions about Barnoldswick
What is the average price for a property for sale in Barnoldswick?
The average price for a property for sale in Barnoldswick is £174,217. This amount is 14% lower than the average price in Lancashire. There are 1,999 property listings for sale in Barnoldswick.
What locations have the most expensive properties for sale in Barnoldswick?
The locations with the most expensive properties for sale in Barnoldswick are Earby & Coates at an average of £229,999, Earby at an average of £189,648 and Coates at an average of £169,349.
What locations have the most affordable properties for sale in Barnoldswick?
The locations with the most affordable properties for sale in Barnoldswick are Craven at an average of £162,165 and Barnoldswick at an average of £166,850.
Which train stations are available in or near Barnoldswick?
Some of the train stations available in or near Barnoldswick are Colne, Gargrave and Nelson.
Property Price Paid in Barnoldswick by Year
The average sold property price by year was:
| Year | Average Sold Price | Price Change |
Sold Properties
|
|---|---|---|---|
| 2024 | £135,991 | -27% |
16 Properties |
| 2023 | £173,336 | -3% |
249 Properties |
| 2022 | £178,392 | 3% |
346 Properties |
| 2021 | £172,788 | 16% |
429 Properties |
| 2020 | £145,339 | -3% |
292 Properties |
| 2019 | £149,901 | 12% |
339 Properties |
| 2018 | £132,508 | -10% |
377 Properties |
| 2017 | £145,978 | 5% |
334 Properties |
| 2016 | £138,804 | 9% |
348 Properties |
| 2015 | £126,352 | 2% |
329 Properties |
| 2014 | £123,930 | 6% |
308 Properties |
| 2013 | £116,200 | -1% |
260 Properties |
| 2012 | £117,091 | 4% |
184 Properties |
| 2011 | £112,915 | -4% |
237 Properties |
| 2010 | £117,551 | -5% |
204 Properties |
| 2009 | £122,894 | -13% |
201 Properties |
| 2008 | £138,722 | 1% |
229 Properties |
| 2007 | £137,768 | 11% |
500 Properties |
| 2006 | £122,275 | 14% |
568 Properties |
| 2005 | £105,652 | 9% |
388 Properties |
| 2004 | £96,411 | 25% |
477 Properties |
| 2003 | £72,038 | 21% |
491 Properties |
| 2002 | £57,204 | 13% |
479 Properties |
| 2001 | £49,958 | 3% |
411 Properties |
| 2000 | £48,532 | 2% |
445 Properties |
| 1999 | £47,613 | -2% |
429 Properties |
| 1998 | £48,501 | 8% |
331 Properties |
| 1997 | £44,454 | 6% |
297 Properties |
| 1996 | £41,706 | -1% |
242 Properties |
| 1995 | £42,318 | - |
257 Properties |
Property Price per Property Type in Barnoldswick
Here you can find historic sold price data in order to help with your property search.
The average Property Paid Price for specific property types in the last three years are:
| Property Type | Average Sold Price | Sold Properties |
|---|---|---|
| Semi Detached House | £213,495.00 | 197 Semi Detached Houses |
| Terraced House | £135,982.00 | 711 Terraced Houses |
| Detached House | £350,369.00 | 117 Detached Houses |
| Flat | £96,763.00 | 15 Flats |