
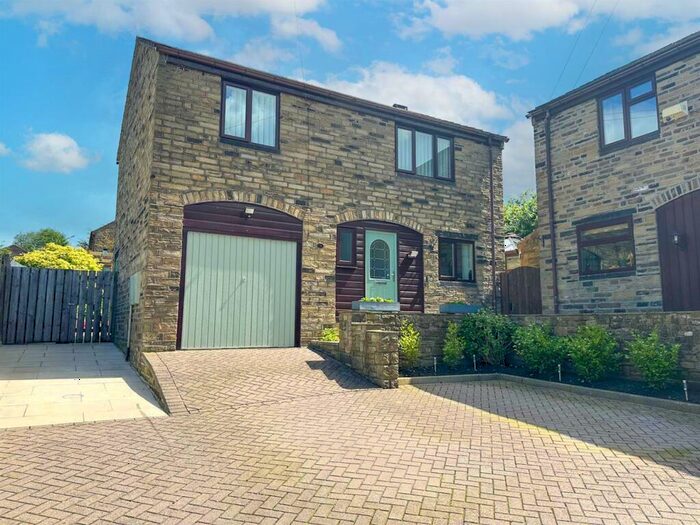
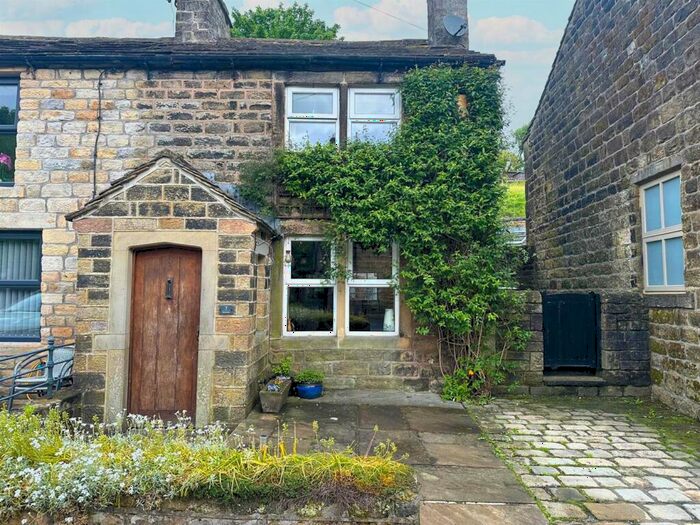
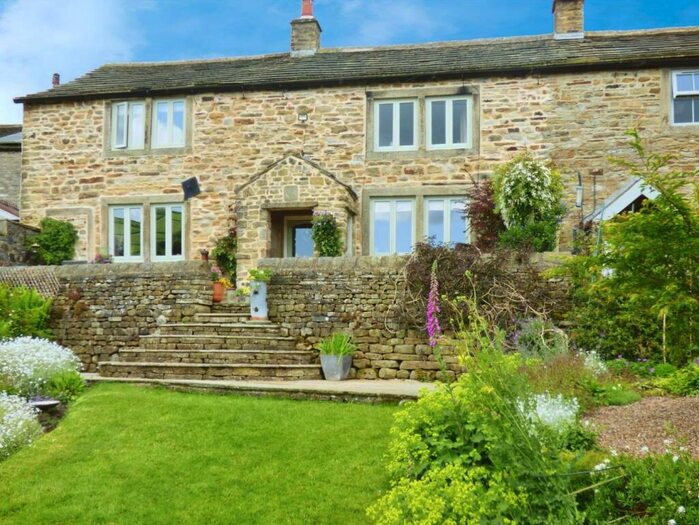
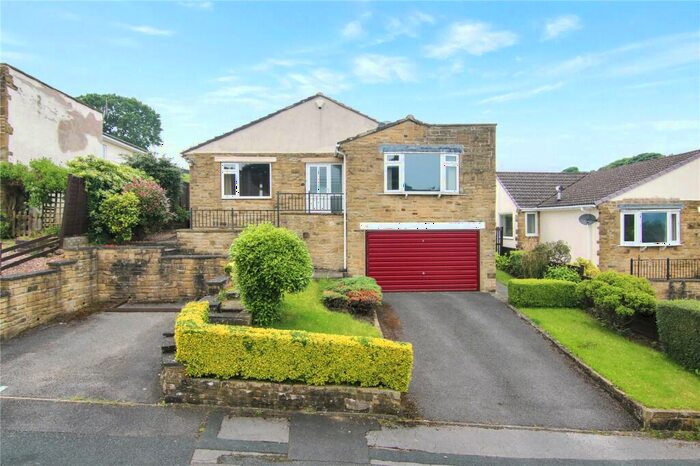
Houses for sale & to rent in Keighley, North Yorkshire
House Prices in Keighley
Properties in Keighley have an average house price of £262,231.00 and had 727 Property Transactions within the last 3 years.¹
Keighley is an area in North Yorkshire with 5,832 households², where the most expensive property was sold for £1,300,000.00.
Properties for sale in Keighley


Neighbourhoods in Keighley
Navigate through our locations to find the location of your next house in Keighley, North Yorkshire for sale or to rent.
Transport in Keighley
Please see below transportation links in this area:

- FAQ
- Price Paid By Year
- Property Type Price
Frequently asked questions about Keighley
What is the average price for a property for sale in Keighley?
The average price for a property for sale in Keighley is £262,231. This amount is 16% lower than the average price in North Yorkshire. There are 2,374 property listings for sale in Keighley.
What locations have the most expensive properties for sale in Keighley?
The locations with the most expensive properties for sale in Keighley are Aire Valley With Lothersdale at an average of £315,702 and Sutton-in-craven at an average of £243,087.
What locations have the most affordable properties for sale in Keighley?
The locations with the most affordable properties for sale in Keighley are Glusburn at an average of £237,724 and Cowling at an average of £239,274.
Which train stations are available in or near Keighley?
Some of the train stations available in or near Keighley are Cononley, Steeton and Silsden and Skipton.
Property Price Paid in Keighley by Year
The average sold property price by year was:
| Year | Average Sold Price | Price Change |
Sold Properties
|
|---|---|---|---|
| 2024 | £246,600 | -7% |
10 Properties |
| 2023 | £264,621 | 2% |
167 Properties |
| 2022 | £258,820 | -2% |
217 Properties |
| 2021 | £263,725 | 2% |
333 Properties |
| 2020 | £258,990 | 6% |
339 Properties |
| 2019 | £242,221 | 10% |
366 Properties |
| 2018 | £219,153 | -4% |
278 Properties |
| 2017 | £228,016 | 6% |
293 Properties |
| 2016 | £213,650 | 11% |
276 Properties |
| 2015 | £190,577 | -4% |
250 Properties |
| 2014 | £198,391 | 9% |
293 Properties |
| 2013 | £181,188 | -6% |
252 Properties |
| 2012 | £191,392 | 4% |
202 Properties |
| 2011 | £183,288 | -1% |
174 Properties |
| 2010 | £185,691 | -1% |
204 Properties |
| 2009 | £186,916 | 3% |
166 Properties |
| 2008 | £181,815 | -3% |
191 Properties |
| 2007 | £188,149 | 2% |
322 Properties |
| 2006 | £184,198 | 6% |
350 Properties |
| 2005 | £172,812 | 13% |
296 Properties |
| 2004 | £150,227 | 14% |
313 Properties |
| 2003 | £128,627 | 13% |
338 Properties |
| 2002 | £111,346 | 16% |
404 Properties |
| 2001 | £93,846 | 21% |
377 Properties |
| 2000 | £73,923 | 2% |
299 Properties |
| 1999 | £72,481 | 3% |
362 Properties |
| 1998 | £70,449 | 8% |
272 Properties |
| 1997 | £64,848 | 6% |
306 Properties |
| 1996 | £61,233 | 3% |
292 Properties |
| 1995 | £59,258 | - |
200 Properties |
Property Price per Property Type in Keighley
Here you can find historic sold price data in order to help with your property search.
The average Property Paid Price for specific property types in the last three years are:
| Property Type | Average Sold Price | Sold Properties |
|---|---|---|
| Semi Detached House | £269,828.00 | 183 Semi Detached Houses |
| Terraced House | £195,957.00 | 367 Terraced Houses |
| Detached House | £468,178.00 | 127 Detached Houses |
| Flat | £197,776.00 | 50 Flats |