
Houses for sale & to rent in Skelmersdale, Lancashire
House Prices in Skelmersdale
Properties in Skelmersdale have an average house price of £151,988.00 and had 1,744 Property Transactions within the last 3 years.¹
Skelmersdale is an area in Lancashire with 17,178 households², where the most expensive property was sold for £915,000.00.
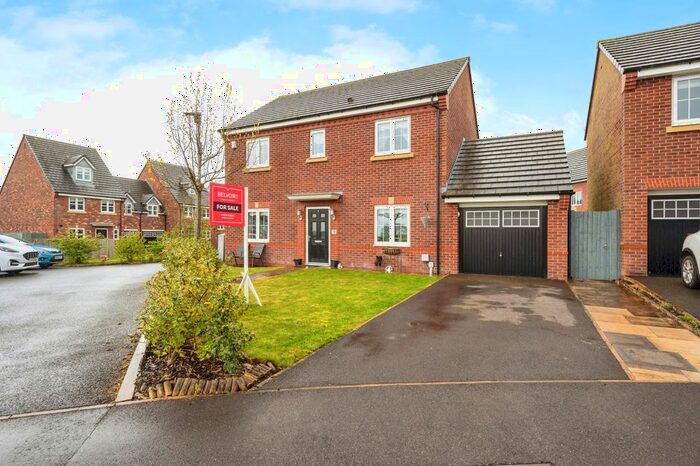
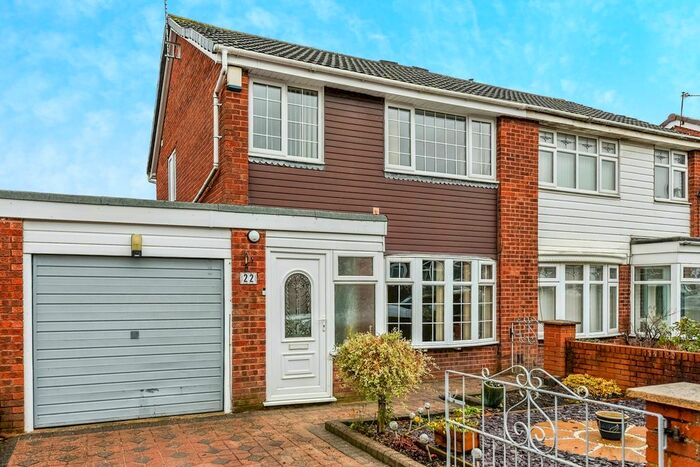
Properties for sale in Skelmersdale


Neighbourhoods in Skelmersdale
Navigate through our locations to find the location of your next house in Skelmersdale, Lancashire for sale or to rent.
Transport in Skelmersdale
Please see below transportation links in this area:

- FAQ
- Price Paid By Year
- Property Type Price
Frequently asked questions about Skelmersdale
What is the average price for a property for sale in Skelmersdale?
The average price for a property for sale in Skelmersdale is £151,988. This amount is 27% lower than the average price in Lancashire. There are 2,279 property listings for sale in Skelmersdale.
What locations have the most expensive properties for sale in Skelmersdale?
The locations with the most expensive properties for sale in Skelmersdale are Wrightington at an average of £303,850, Bickerstaffe at an average of £274,582 and Up Holland at an average of £219,926.
What locations have the most affordable properties for sale in Skelmersdale?
The locations with the most affordable properties for sale in Skelmersdale are Moorside at an average of £105,124, Digmoor at an average of £109,459 and Birch Green at an average of £119,574.
Which train stations are available in or near Skelmersdale?
Some of the train stations available in or near Skelmersdale are Upholland, Rainford and Orrell.
Property Price Paid in Skelmersdale by Year
The average sold property price by year was:
| Year | Average Sold Price | Price Change |
Sold Properties
|
|---|---|---|---|
| 2024 | £126,387 | -20% |
40 Properties |
| 2023 | £151,965 | 3% |
412 Properties |
| 2022 | £147,785 | -6% |
548 Properties |
| 2021 | £156,473 | 4% |
744 Properties |
| 2020 | £149,802 | 7% |
586 Properties |
| 2019 | £139,177 | 5% |
589 Properties |
| 2018 | £132,680 | -3% |
506 Properties |
| 2017 | £136,213 | -4% |
461 Properties |
| 2016 | £141,453 | 12% |
467 Properties |
| 2015 | £123,910 | 11% |
426 Properties |
| 2014 | £110,140 | -13% |
385 Properties |
| 2013 | £124,066 | 4% |
307 Properties |
| 2012 | £118,887 | -1% |
267 Properties |
| 2011 | £119,698 | -6% |
240 Properties |
| 2010 | £126,455 | 5% |
277 Properties |
| 2009 | £120,197 | 1% |
229 Properties |
| 2008 | £118,684 | -4% |
327 Properties |
| 2007 | £122,997 | 11% |
720 Properties |
| 2006 | £109,535 | 3% |
805 Properties |
| 2005 | £106,237 | 2% |
717 Properties |
| 2004 | £103,979 | 22% |
900 Properties |
| 2003 | £81,500 | 13% |
891 Properties |
| 2002 | £71,148 | 14% |
918 Properties |
| 2001 | £61,226 | 2% |
682 Properties |
| 2000 | £59,731 | 4% |
661 Properties |
| 1999 | £57,435 | 12% |
586 Properties |
| 1998 | £50,292 | 3% |
533 Properties |
| 1997 | £48,840 | 6% |
486 Properties |
| 1996 | £45,685 | 3% |
421 Properties |
| 1995 | £44,115 | - |
324 Properties |
Property Price per Property Type in Skelmersdale
Here you can find historic sold price data in order to help with your property search.
The average Property Paid Price for specific property types in the last three years are:
| Property Type | Average Sold Price | Sold Properties |
|---|---|---|
| Semi Detached House | £156,836.00 | 533 Semi Detached Houses |
| Terraced House | £103,594.00 | 776 Terraced Houses |
| Detached House | £268,309.00 | 352 Detached Houses |
| Flat | £80,003.00 | 83 Flats |