
Houses for sale & to rent in Southport, Lancashire
House Prices in Southport
Properties in Southport have an average house price of £239,844.00 and had 373 Property Transactions within the last 3 years.¹
Southport is an area in Lancashire with 2,621 households², where the most expensive property was sold for £1,375,000.00.
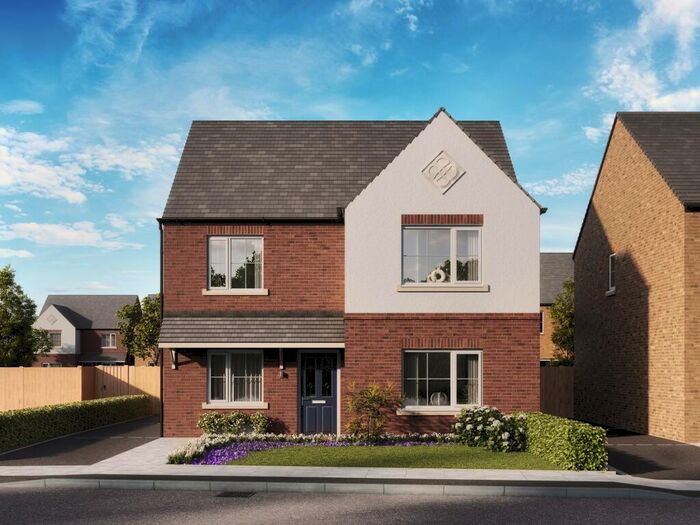
Properties for sale in Southport


Neighbourhoods in Southport
Navigate through our locations to find the location of your next house in Southport, Lancashire for sale or to rent.
Transport in Southport
Please see below transportation links in this area:

- FAQ
- Price Paid By Year
- Property Type Price
Frequently asked questions about Southport
What is the average price for a property for sale in Southport?
The average price for a property for sale in Southport is £239,844. This amount is 18% higher than the average price in Lancashire. There are 8,245 property listings for sale in Southport.
What locations have the most expensive properties for sale in Southport?
The locations with the most expensive properties for sale in Southport are Halsall at an average of £273,645 and Scarisbrick at an average of £258,450.
What locations have the most affordable properties for sale in Southport?
The location with the most affordable properties for sale in Southport is North Meols at an average of £231,983.
Which train stations are available in or near Southport?
Some of the train stations available in or near Southport are Meols Cop, Bescar Lane and Southport.
Property Price Paid in Southport by Year
The average sold property price by year was:
| Year | Average Sold Price | Price Change |
Sold Properties
|
|---|---|---|---|
| 2024 | £244,200 | -1% |
5 Properties |
| 2023 | £247,471 | 1% |
116 Properties |
| 2022 | £244,587 | 6% |
114 Properties |
| 2021 | £229,357 | 7% |
138 Properties |
| 2020 | £212,802 | 5% |
119 Properties |
| 2019 | £203,179 | 9% |
133 Properties |
| 2018 | £185,059 | 1% |
115 Properties |
| 2017 | £182,292 | -11% |
134 Properties |
| 2016 | £201,857 | -1% |
130 Properties |
| 2015 | £202,905 | 15% |
109 Properties |
| 2014 | £173,473 | 7% |
101 Properties |
| 2013 | £161,182 | 6% |
64 Properties |
| 2012 | £151,604 | -13% |
48 Properties |
| 2011 | £170,910 | 11% |
59 Properties |
| 2010 | £151,661 | -27% |
52 Properties |
| 2009 | £192,883 | 6% |
49 Properties |
| 2008 | £181,927 | -10% |
57 Properties |
| 2007 | £199,955 | 1% |
133 Properties |
| 2006 | £197,073 | 8% |
125 Properties |
| 2005 | £180,885 | -1% |
102 Properties |
| 2004 | £183,597 | 29% |
156 Properties |
| 2003 | £130,934 | 12% |
158 Properties |
| 2002 | £115,303 | 9% |
191 Properties |
| 2001 | £105,245 | 2% |
200 Properties |
| 2000 | £103,080 | 11% |
145 Properties |
| 1999 | £92,182 | 3% |
128 Properties |
| 1998 | £89,755 | 6% |
144 Properties |
| 1997 | £84,039 | 31% |
154 Properties |
| 1996 | £58,348 | 13% |
58 Properties |
| 1995 | £50,970 | - |
44 Properties |
Property Price per Property Type in Southport
Here you can find historic sold price data in order to help with your property search.
The average Property Paid Price for specific property types in the last three years are:
| Property Type | Average Sold Price | Sold Properties |
|---|---|---|
| Flat | £118,036.00 | 30 Flats |
| Semi Detached House | £195,944.00 | 181 Semi Detached Houses |
| Detached House | £335,417.00 | 136 Detached Houses |
| Terraced House | £186,076.00 | 26 Terraced Houses |