
Houses for sale & to rent in Markfield, Leicestershire
House Prices in Markfield
Properties in Markfield have an average house price of £278,896.00 and had 332 Property Transactions within the last 3 years.¹
Markfield is an area in Leicestershire with 2,674 households², where the most expensive property was sold for £1,850,000.00.
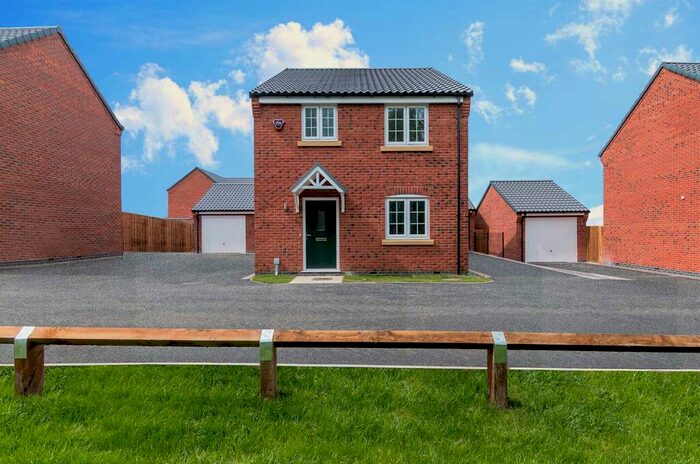
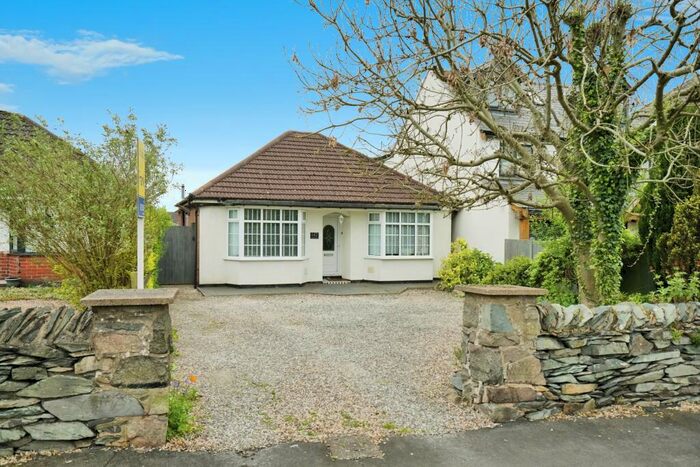
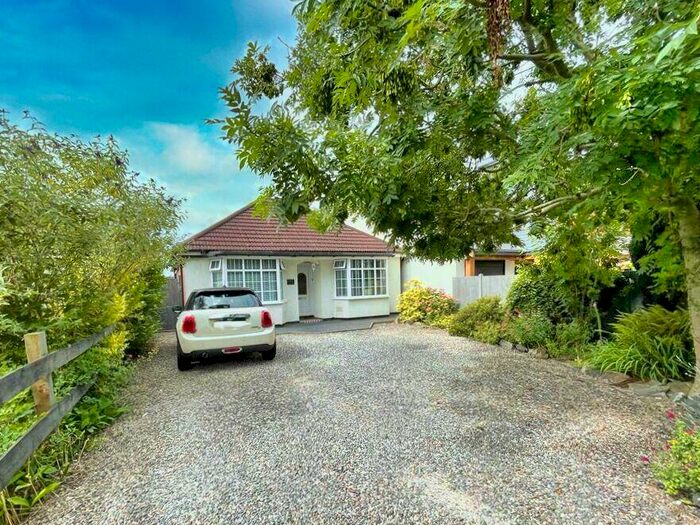
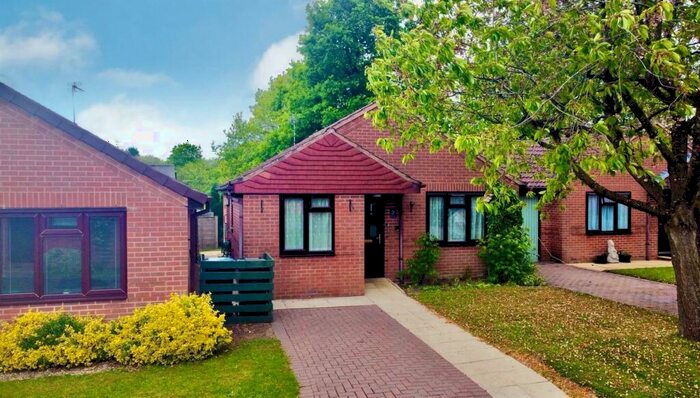
Properties for sale in Markfield


Neighbourhoods in Markfield
Navigate through our locations to find the location of your next house in Markfield, Leicestershire for sale or to rent.
Transport in Markfield
Please see below transportation links in this area:
-
 Barrow-Upon-Soar Station
 -
Loughborough Station
-
Leicester Station
-
Sileby Station
-
Syston Station
-
Narborough Station
-
South Wigston Station
- FAQ
- Price Paid By Year
- Property Type Price
Frequently asked questions about Markfield
What is the average price for a property for sale in Markfield?
The average price for a property for sale in Markfield is £278,896. This amount is 5% lower than the average price in Leicestershire. There are 497 property listings for sale in Markfield.
What locations have the most expensive properties for sale in Markfield?
The locations with the most expensive properties for sale in Markfield are Ratby, Bagworth And Thornton at an average of £910,165 and Forest Bradgate at an average of £806,681.
What locations have the most affordable properties for sale in Markfield?
The locations with the most affordable properties for sale in Markfield are Markfield, Stanton And Fieldhead at an average of £253,295 and Bardon at an average of £695,000.
Which train stations are available in or near Markfield?
Some of the train stations available in or near Markfield are Barrow-Upon-Soar, Loughborough and Leicester.
Property Price Paid in Markfield by Year
The average sold property price by year was:
| Year | Average Sold Price | Price Change |
Sold Properties
|
|---|---|---|---|
| 2024 | £259,125 | -17% |
4 Properties |
| 2023 | £301,956 | 11% |
82 Properties |
| 2022 | £268,270 | -2% |
112 Properties |
| 2021 | £274,256 | 10% |
134 Properties |
| 2020 | £246,730 | 15% |
95 Properties |
| 2019 | £208,747 | -10% |
131 Properties |
| 2018 | £228,868 | 0,1% |
130 Properties |
| 2017 | £228,732 | 5% |
116 Properties |
| 2016 | £216,830 | 11% |
126 Properties |
| 2015 | £192,738 | 11% |
169 Properties |
| 2014 | £172,384 | 9% |
135 Properties |
| 2013 | £157,155 | 3% |
114 Properties |
| 2012 | £151,838 | -45% |
59 Properties |
| 2011 | £220,923 | 17% |
63 Properties |
| 2010 | £183,709 | 20% |
76 Properties |
| 2009 | £147,843 | -11% |
82 Properties |
| 2008 | £163,549 | -15% |
65 Properties |
| 2007 | £187,652 | 2% |
114 Properties |
| 2006 | £183,246 | 4% |
139 Properties |
| 2005 | £175,678 | 11% |
131 Properties |
| 2004 | £156,759 | 16% |
134 Properties |
| 2003 | £132,352 | 4% |
121 Properties |
| 2002 | £126,704 | 26% |
169 Properties |
| 2001 | £93,977 | 3% |
149 Properties |
| 2000 | £91,228 | 5% |
154 Properties |
| 1999 | £86,571 | 11% |
168 Properties |
| 1998 | £76,665 | 6% |
138 Properties |
| 1997 | £71,845 | 11% |
147 Properties |
| 1996 | £64,296 | 1% |
140 Properties |
| 1995 | £63,665 | - |
119 Properties |
Property Price per Property Type in Markfield
Here you can find historic sold price data in order to help with your property search.
The average Property Paid Price for specific property types in the last three years are:
| Property Type | Average Sold Price | Sold Properties |
|---|---|---|
| Flat | £121,206.00 | 23 Flats |
| Semi Detached House | £231,745.00 | 105 Semi Detached Houses |
| Terraced House | £189,270.00 | 76 Terraced Houses |
| Detached House | £399,126.00 | 128 Detached Houses |