
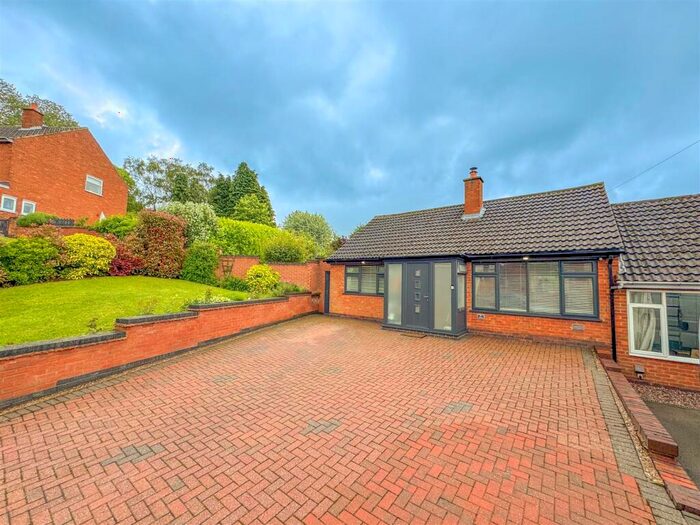
Houses for sale & to rent in Nuneaton, Leicestershire
House Prices in Nuneaton
Properties in Nuneaton have an average house price of £397,149.00 and had 458 Property Transactions within the last 3 years.¹
Nuneaton is an area in Leicestershire with 4,493 households², where the most expensive property was sold for £2,300,000.00.
Properties for sale in Nuneaton


Neighbourhoods in Nuneaton
Navigate through our locations to find the location of your next house in Nuneaton, Leicestershire for sale or to rent.
Transport in Nuneaton
Please see below transportation links in this area:
-
 Hinckley Station
 -
Atherstone Station
-
Nuneaton Station
-
Polesworth Station
-
Bermuda Park Station
-
Narborough Station
-
Bedworth Station
- FAQ
- Price Paid By Year
- Property Type Price
Frequently asked questions about Nuneaton
What is the average price for a property for sale in Nuneaton?
The average price for a property for sale in Nuneaton is £397,149. This amount is 30% higher than the average price in Leicestershire. There are 7,652 property listings for sale in Nuneaton.
What locations have the most expensive properties for sale in Nuneaton?
The locations with the most expensive properties for sale in Nuneaton are Cadeby, Carlton And Market Bosworth With Shackerstone at an average of £480,707 and Ambien at an average of £393,630.
What locations have the most affordable properties for sale in Nuneaton?
The locations with the most affordable properties for sale in Nuneaton are Barlestone, Nailstone And Osbaston at an average of £295,595 and Twycross And Witherley With Sheepy at an average of £383,333.
Which train stations are available in or near Nuneaton?
Some of the train stations available in or near Nuneaton are Hinckley, Atherstone and Nuneaton.
Property Price Paid in Nuneaton by Year
The average sold property price by year was:
| Year | Average Sold Price | Price Change |
Sold Properties
|
|---|---|---|---|
| 2024 | £563,499 | 33% |
5 Properties |
| 2023 | £379,878 | -16% |
103 Properties |
| 2022 | £439,947 | 15% |
143 Properties |
| 2021 | £372,160 | -1% |
207 Properties |
| 2020 | £375,099 | 14% |
151 Properties |
| 2019 | £321,530 | -5% |
182 Properties |
| 2018 | £338,305 | 12% |
218 Properties |
| 2017 | £298,424 | 6% |
251 Properties |
| 2016 | £279,232 | -0,2% |
208 Properties |
| 2015 | £279,889 | 11% |
188 Properties |
| 2014 | £248,056 | -10% |
186 Properties |
| 2013 | £272,101 | 10% |
136 Properties |
| 2012 | £243,914 | 3% |
131 Properties |
| 2011 | £237,627 | -20% |
109 Properties |
| 2010 | £285,725 | 16% |
93 Properties |
| 2009 | £240,910 | -1% |
126 Properties |
| 2008 | £244,370 | -24% |
95 Properties |
| 2007 | £302,590 | 22% |
190 Properties |
| 2006 | £236,624 | 0,2% |
224 Properties |
| 2005 | £236,129 | 6% |
197 Properties |
| 2004 | £221,702 | 13% |
199 Properties |
| 2003 | £192,704 | 15% |
177 Properties |
| 2002 | £164,480 | 15% |
193 Properties |
| 2001 | £140,092 | 12% |
211 Properties |
| 2000 | £123,074 | 9% |
168 Properties |
| 1999 | £112,421 | 20% |
200 Properties |
| 1998 | £89,794 | 2% |
146 Properties |
| 1997 | £87,646 | 7% |
217 Properties |
| 1996 | £81,875 | 4% |
195 Properties |
| 1995 | £78,483 | - |
151 Properties |
Property Price per Property Type in Nuneaton
Here you can find historic sold price data in order to help with your property search.
The average Property Paid Price for specific property types in the last three years are:
| Property Type | Average Sold Price | Sold Properties |
|---|---|---|
| Semi Detached House | £283,737.00 | 134 Semi Detached Houses |
| Detached House | £522,955.00 | 230 Detached Houses |
| Flat | £229,650.00 | 10 Flats |
| Terraced House | £253,542.00 | 84 Terraced Houses |