
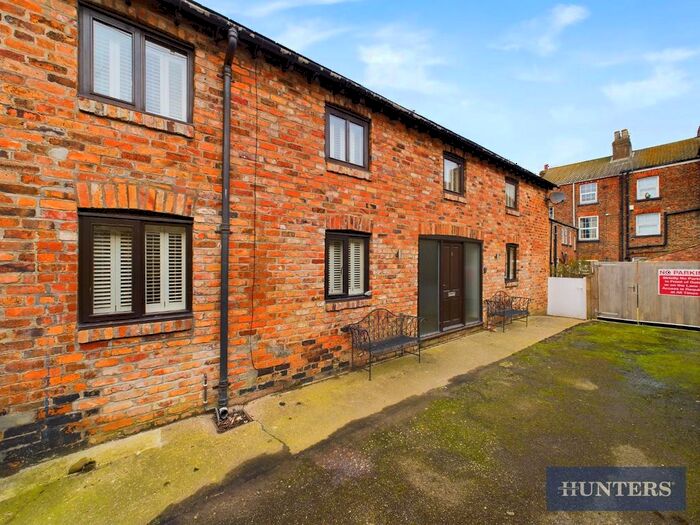
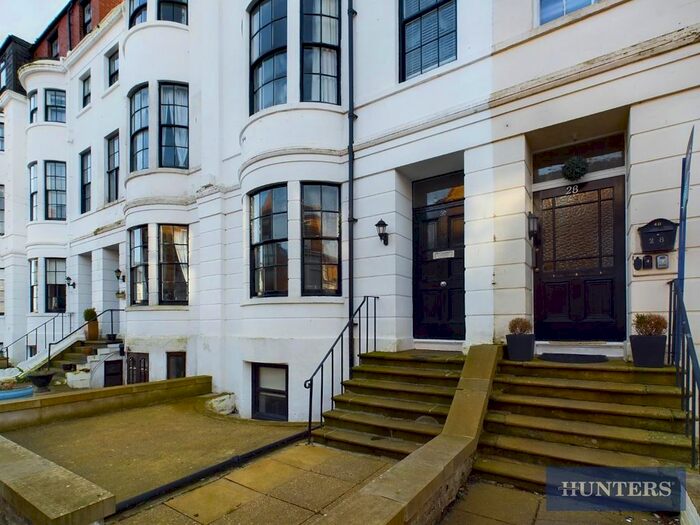
Houses for sale & to rent in Filey, North Yorkshire
House Prices in Filey
Properties in Filey have an average house price of £209,545.00 and had 899 Property Transactions within the last 3 years.¹
Filey is an area in North Yorkshire with 5,393 households², where the most expensive property was sold for £1,250,000.00.
Properties for sale in Filey


Neighbourhoods in Filey
Navigate through our locations to find the location of your next house in Filey, North Yorkshire for sale or to rent.
Transport in Filey
Please see below transportation links in this area:
-
 Filey Station
 -
Hunmanby Station
-
Seamer Station
-
Bempton Station
-
Scarborough Station
-
Bridlington Station
- FAQ
- Price Paid By Year
- Property Type Price
Frequently asked questions about Filey
What is the average price for a property for sale in Filey?
The average price for a property for sale in Filey is £209,545. This amount is 38% lower than the average price in North Yorkshire. There are 1,465 property listings for sale in Filey.
What locations have the most expensive properties for sale in Filey?
The locations with the most expensive properties for sale in Filey are Hunmanby at an average of £240,000 and Cayton at an average of £221,505.
What locations have the most affordable properties for sale in Filey?
The locations with the most affordable properties for sale in Filey are Filey at an average of £206,194 and Hertford at an average of £214,472.
Which train stations are available in or near Filey?
Some of the train stations available in or near Filey are Filey, Hunmanby and Seamer.
Property Price Paid in Filey by Year
The average sold property price by year was:
| Year | Average Sold Price | Price Change |
Sold Properties
|
|---|---|---|---|
| 2024 | £189,482 | -18% |
23 Properties |
| 2023 | £223,401 | 4% |
197 Properties |
| 2022 | £214,684 | 7% |
321 Properties |
| 2021 | £198,602 | 4% |
358 Properties |
| 2020 | £190,705 | 13% |
257 Properties |
| 2019 | £166,679 | -1% |
303 Properties |
| 2018 | £168,039 | 1% |
305 Properties |
| 2017 | £166,410 | 7% |
383 Properties |
| 2016 | £154,221 | -2% |
353 Properties |
| 2015 | £156,576 | 3% |
333 Properties |
| 2014 | £151,182 | 1% |
318 Properties |
| 2013 | £149,286 | -5% |
278 Properties |
| 2012 | £157,452 | 3% |
207 Properties |
| 2011 | £152,459 | -4% |
199 Properties |
| 2010 | £158,029 | 3% |
198 Properties |
| 2009 | £152,597 | -9% |
209 Properties |
| 2008 | £166,294 | 6% |
251 Properties |
| 2007 | £156,957 | 5% |
435 Properties |
| 2006 | £149,860 | -4% |
416 Properties |
| 2005 | £155,646 | 8% |
324 Properties |
| 2004 | £142,787 | 25% |
369 Properties |
| 2003 | £106,854 | 19% |
369 Properties |
| 2002 | £86,084 | 24% |
420 Properties |
| 2001 | £65,758 | 3% |
408 Properties |
| 2000 | £63,961 | 2% |
409 Properties |
| 1999 | £62,837 | 12% |
379 Properties |
| 1998 | £55,433 | 3% |
322 Properties |
| 1997 | £53,865 | 1% |
296 Properties |
| 1996 | £53,488 | 1% |
244 Properties |
| 1995 | £52,864 | - |
212 Properties |
Property Price per Property Type in Filey
Here you can find historic sold price data in order to help with your property search.
The average Property Paid Price for specific property types in the last three years are:
| Property Type | Average Sold Price | Sold Properties |
|---|---|---|
| Semi Detached House | £205,279.00 | 256 Semi Detached Houses |
| Terraced House | £170,107.00 | 189 Terraced Houses |
| Detached House | £290,906.00 | 267 Detached Houses |
| Flat | £139,077.00 | 187 Flats |