
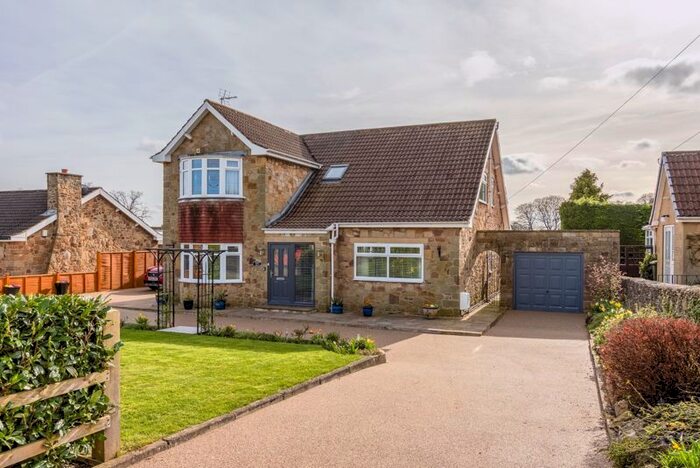
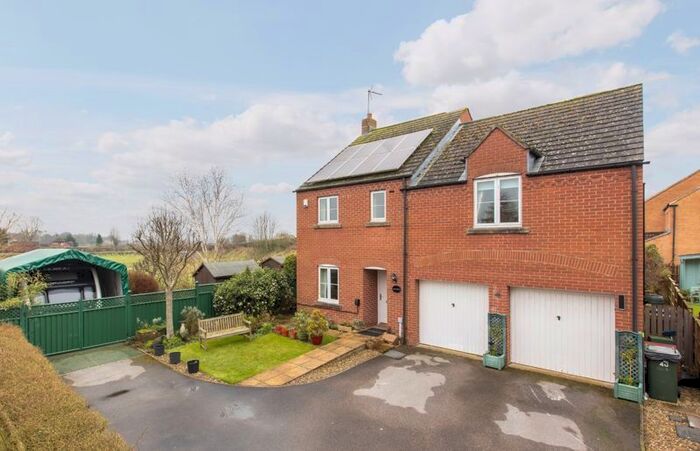
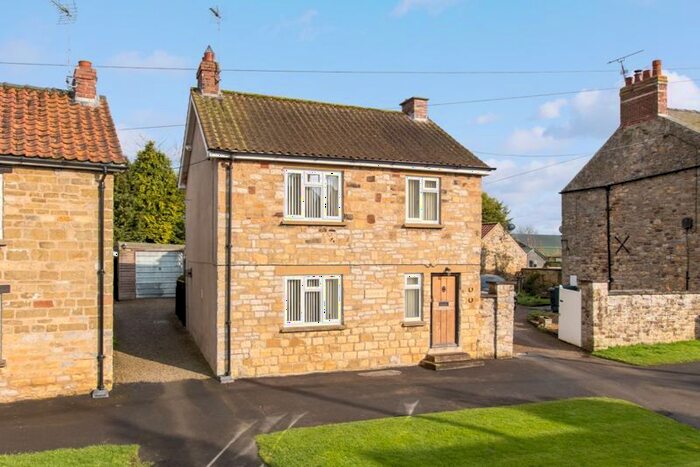
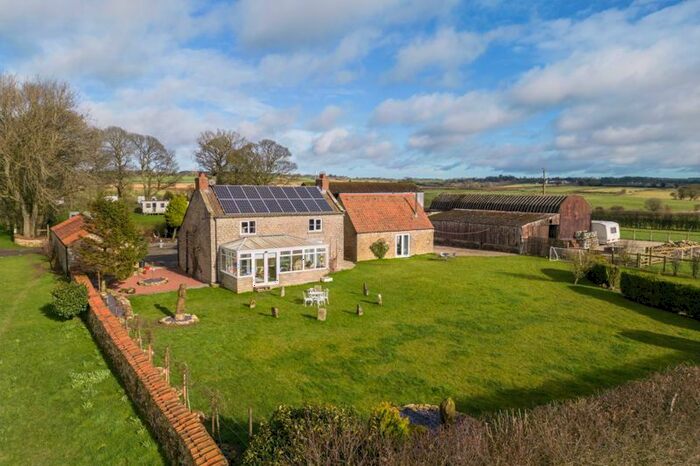
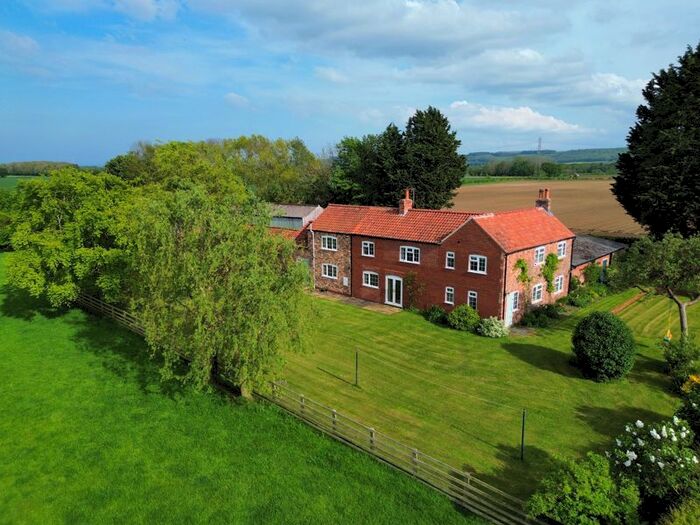
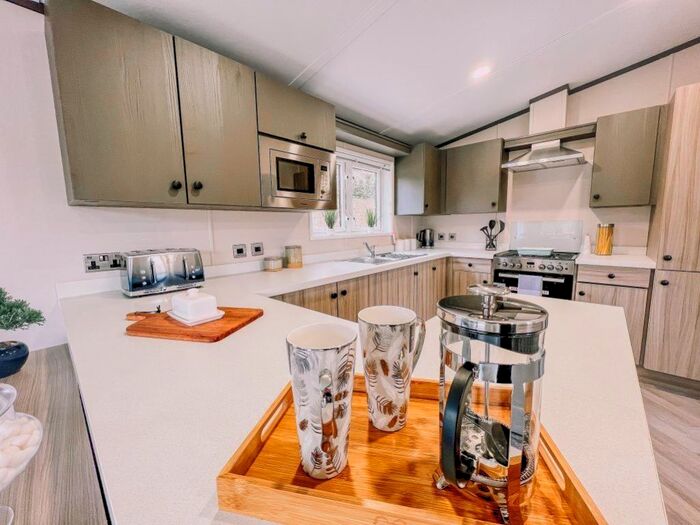
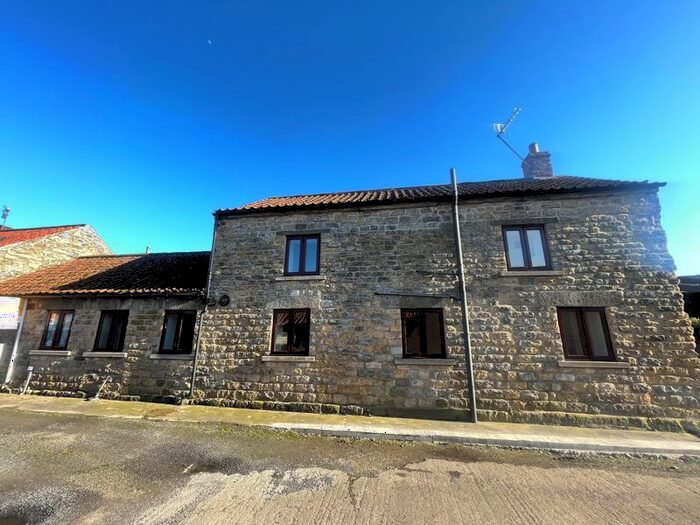
Houses for sale & to rent in Pickering, North Yorkshire
House Prices in Pickering
Properties in Pickering have an average house price of £295,788.00 and had 677 Property Transactions within the last 3 years.¹
Pickering is an area in North Yorkshire with 4,917 households², where the most expensive property was sold for £1,665,000.00.
Properties for sale in Pickering


Neighbourhoods in Pickering
Navigate through our locations to find the location of your next house in Pickering, North Yorkshire for sale or to rent.
Transport in Pickering
Please see below transportation links in this area:
-
 Malton Station
 -
Egton Station
-
Grosmont Station
-
Glaisdale Station
-
Lealholm Station
-
Seamer Station
-
Sleights Station
-
Scarborough Station
- FAQ
- Price Paid By Year
- Property Type Price
Frequently asked questions about Pickering
What is the average price for a property for sale in Pickering?
The average price for a property for sale in Pickering is £295,788. This amount is 4% lower than the average price in North Yorkshire. There are 1,573 property listings for sale in Pickering.
What locations have the most expensive properties for sale in Pickering?
The locations with the most expensive properties for sale in Pickering are Cropton at an average of £366,308, Thornton Dale at an average of £359,468 and Dales at an average of £344,906.
What locations have the most affordable properties for sale in Pickering?
The locations with the most affordable properties for sale in Pickering are Pickering West at an average of £262,859 and Pickering East at an average of £265,009.
Which train stations are available in or near Pickering?
Some of the train stations available in or near Pickering are Malton, Egton and Grosmont.
Property Price Paid in Pickering by Year
The average sold property price by year was:
| Year | Average Sold Price | Price Change |
Sold Properties
|
|---|---|---|---|
| 2024 | £324,845 | 4% |
10 Properties |
| 2023 | £311,266 | 2% |
177 Properties |
| 2022 | £305,743 | 9% |
213 Properties |
| 2021 | £277,194 | 6% |
277 Properties |
| 2020 | £260,614 | 13% |
270 Properties |
| 2019 | £227,060 | -8% |
270 Properties |
| 2018 | £245,650 | 7% |
246 Properties |
| 2017 | £228,946 | -4% |
269 Properties |
| 2016 | £238,057 | 15% |
266 Properties |
| 2015 | £202,988 | -1% |
265 Properties |
| 2014 | £204,563 | -0,1% |
223 Properties |
| 2013 | £204,688 | -1% |
242 Properties |
| 2012 | £206,343 | -8% |
179 Properties |
| 2011 | £223,034 | 2% |
164 Properties |
| 2010 | £218,927 | 6% |
163 Properties |
| 2009 | £205,335 | -10% |
157 Properties |
| 2008 | £226,470 | 1% |
125 Properties |
| 2007 | £225,103 | 2% |
248 Properties |
| 2006 | £220,073 | 11% |
254 Properties |
| 2005 | £196,270 | 1% |
190 Properties |
| 2004 | £194,906 | 19% |
208 Properties |
| 2003 | £158,501 | 21% |
266 Properties |
| 2002 | £125,882 | 19% |
273 Properties |
| 2001 | £101,459 | 13% |
223 Properties |
| 2000 | £88,300 | 4% |
252 Properties |
| 1999 | £84,351 | 10% |
233 Properties |
| 1998 | £75,547 | 3% |
213 Properties |
| 1997 | £72,956 | 5% |
242 Properties |
| 1996 | £69,492 | -2% |
239 Properties |
| 1995 | £70,991 | - |
203 Properties |
Property Price per Property Type in Pickering
Here you can find historic sold price data in order to help with your property search.
The average Property Paid Price for specific property types in the last three years are:
| Property Type | Average Sold Price | Sold Properties |
|---|---|---|
| Semi Detached House | £239,725.00 | 171 Semi Detached Houses |
| Terraced House | £246,058.00 | 188 Terraced Houses |
| Detached House | £388,776.00 | 271 Detached Houses |
| Flat | £162,518.00 | 47 Flats |